Disclaimer: All testing was performed against infrastructure owned and operated by the author in a private lab environment. Unauthorized access to computer systems is illegal under the Computer Fraud and Abuse Act (18 U.S.C. § 1030) and equivalent laws in other jurisdictions. This content is provided for educational and defensive security research purposes only. Do not test against systems you do not own or have explicit written authorization to test.
This content represents personal educational work conducted in a home lab environment on personal equipment. It does not reflect the views, opinions, or positions of any employer or affiliated organization. All security methodologies are derived from publicly available frameworks, published CVE advisories, and open-source tool documentation. All tools referenced are free, open-source, and publicly available.
Intentionally Insecure Lab Environment
This deployment is deliberately configured without TLS, reverse proxies, or secrets management. It exists to expose and document the full attack surface of a vanilla monitoring stack so that hardening decisions in later phases are informed, not assumed.
Do not replicate this configuration in production or on any network exposed to untrusted traffic. The hardening series that follows this post addresses every exposure documented here.
The Setup Nobody Documents Properly
You want centralized authentication for your monitoring stack. Reasonable ask. You pick Authentik because it’s open-source, self-hosted, and supports OAuth2/OIDC natively. You pick Grafana because it’s Grafana. You figure: two well-documented projects, one standardized protocol, a couple hours tops.
It took considerably longer than that. Not because the tools are bad, but because OAuth integration across network segments has a dozen failure modes, and the error messages for most of them are identical. “Failed to get token from provider” could mean five different things.
This post documents the full deployment of an OAuth-authenticated monitoring stack using Authentik 2025.12.3 as the identity provider and Grafana as the frontend, connected via OIDC across a multi-VLAN lab environment. More importantly, it documents the 11 things that broke, how each was diagnosed, and what the actual fix was.
One deliberate choice up front: this is a vanilla, unsecured deployment. No TLS. No reverse proxy. No secret injection. That’s on purpose. If you jump straight to HTTPS and certificate automation, you close off your ability to see what the actual attack surface looks like. You can’t defend what you haven’t observed. This deployment is about understanding every exposed port, every plaintext credential path, every trust boundary – so that when we harden it in later phases, we’re making informed decisions instead of just ticking boxes.
Architecture
Two hosts on separate VLANs, talking to each other over routed subnets. Both are Debian 13 (Trixie), 2 cores, 4 GB RAM, 20 GB disk. Nothing exotic – this runs on whatever spare hardware you have lying around.
| Host | IP | VLAN | Role |
|---|---|---|---|
| Authentik-lab | 192.168.80.54 | VLAN 80 | Identity Provider |
| Grafana-lab | 192.168.75.109 | VLAN 75 | Monitoring Stack |
Authentik-lab runs three containers: the Authentik server (ports 9000/9443), a background worker, and PostgreSQL 16. No Redis – Authentik 2025.12 removed that dependency entirely and handles caching and task queuing through PostgreSQL.
Grafana-lab runs five containers across two Docker networks. This is where it gets interesting.
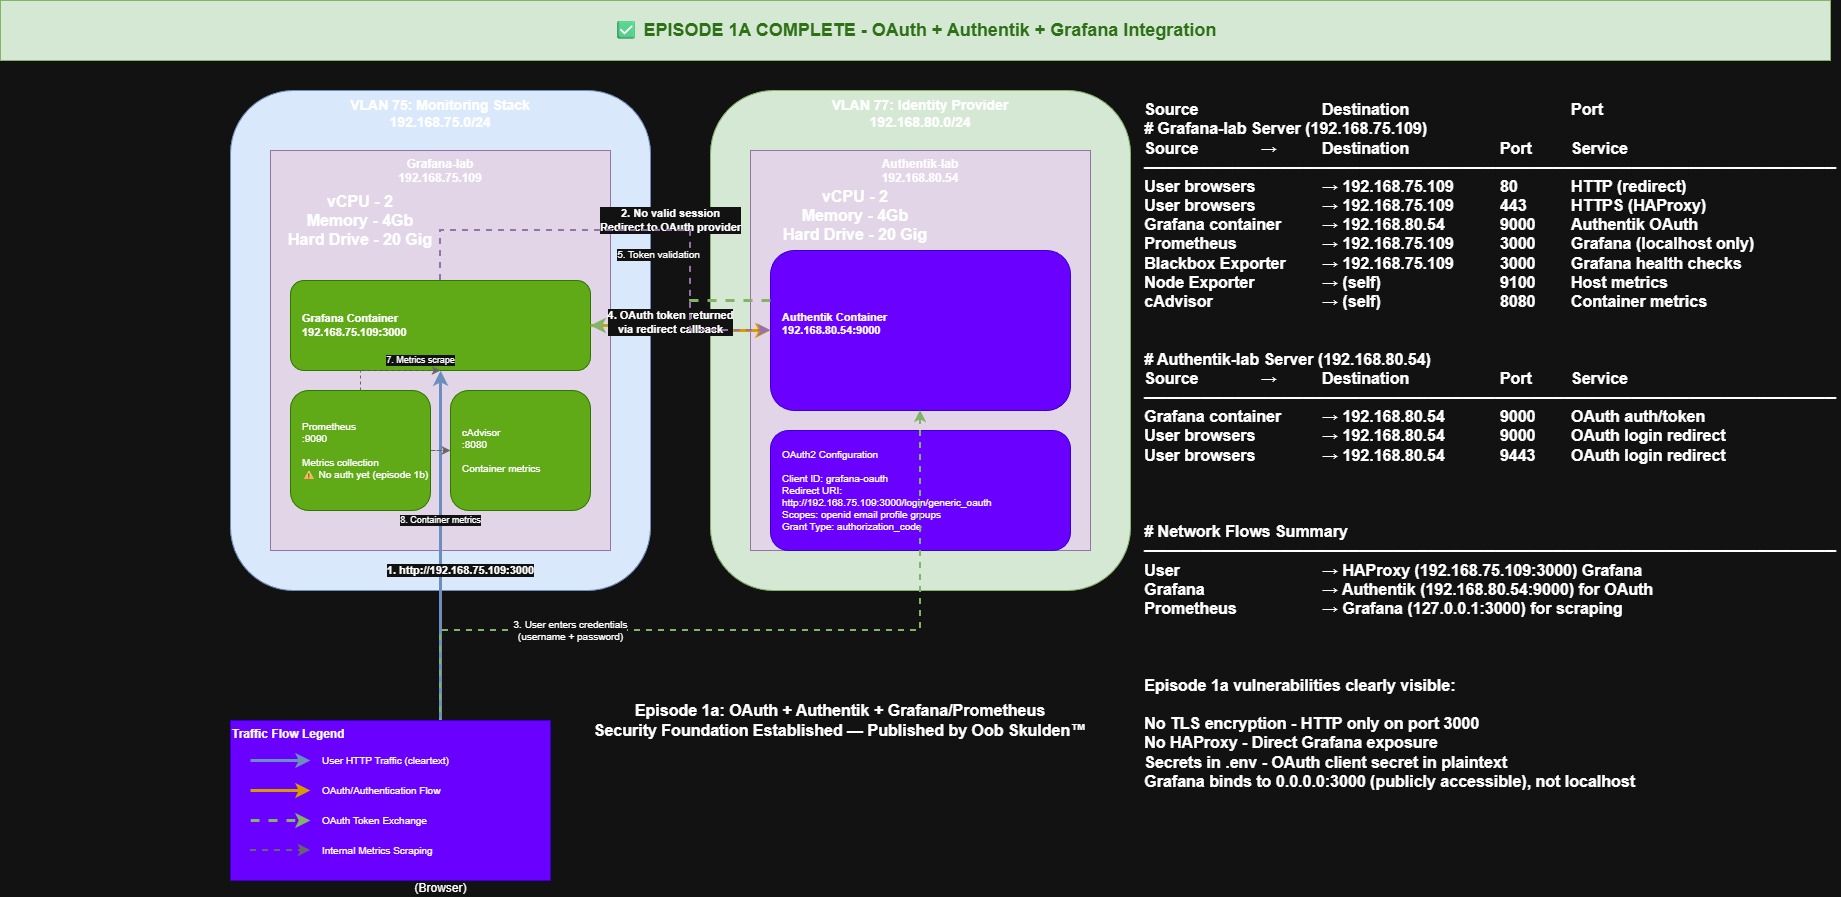
Grafana, Prometheus, and Blackbox Exporter share grafana_network. Node Exporter and cAdvisor live on a separate prometheus_network. Prometheus bridges both because it’s the collector – it needs to reach every exporter. But Grafana doesn’t need direct access to Node Exporter or cAdvisor. Separating them limits lateral movement if any single container is compromised. That’s a smaller trust boundary than putting everything on one flat network, and it costs you nothing to set up.
grafana_network:
  +-- grafana           (port 3000)
  +-- prometheus        (port 9090)
  +-- blackbox-exporter (port 9115)

prometheus_network:
  +-- prometheus        (bridges both networks)
  +-- node-exporter     (port 9100)
  +-- cadvisor          (port 8080)

Cross-VLAN:
  Grafana (VLAN 75) <--OIDC--> Authentik (VLAN 80)
A future phase adds OpenBAO on VLAN 100 for secrets management (that’s a big enough topic to get its own dedicated series) and HAProxy for TLS termination. But this deployment runs HTTP deliberately. You learn more about a system’s vulnerabilities by watching it operate without guardrails than by locking everything down on day one and hoping you covered it all.
Software Prerequisites
Same packages on both hosts. Do this before deploying anything – chasing missing dependencies mid-setup is a waste of time you won’t get back.
# Update system
sudo apt update && sudo apt upgrade -y

# Install Docker CE
sudo apt install -y docker.io docker-compose-plugin

# Start and enable Docker
sudo systemctl enable docker
sudo systemctl start docker

# Verify Docker installation
docker --version
docker compose version

# Add your user to the docker group (log out and back in after)
sudo usermod -aG docker $USER

# Install utilities
sudo apt install -y \
  curl \
  wget \
  jq \
  net-tools \
  netcat-openbsd \
  iptables-persistent
The iptables-persistent package matters more than it looks – it’s how the firewall rules survive a reboot when we get to hardening.
The OAuth Flow (And Why TLS Gets Weird)
Understanding two distinct connection types in the OAuth2/OIDC flow saves hours of debugging.
First, the user’s browser redirects to Authentik for login. This is a browser-to-server connection. If Authentik is running a self-signed cert, the user can click through the warning and move on.
Second, after the user authenticates and gets redirected back with an authorization code, Grafana’s backend makes a server-to-server HTTP call to Authentik’s token endpoint to exchange that code for tokens. This call enforces strict TLS validation. No click-through option. No human in the loop.
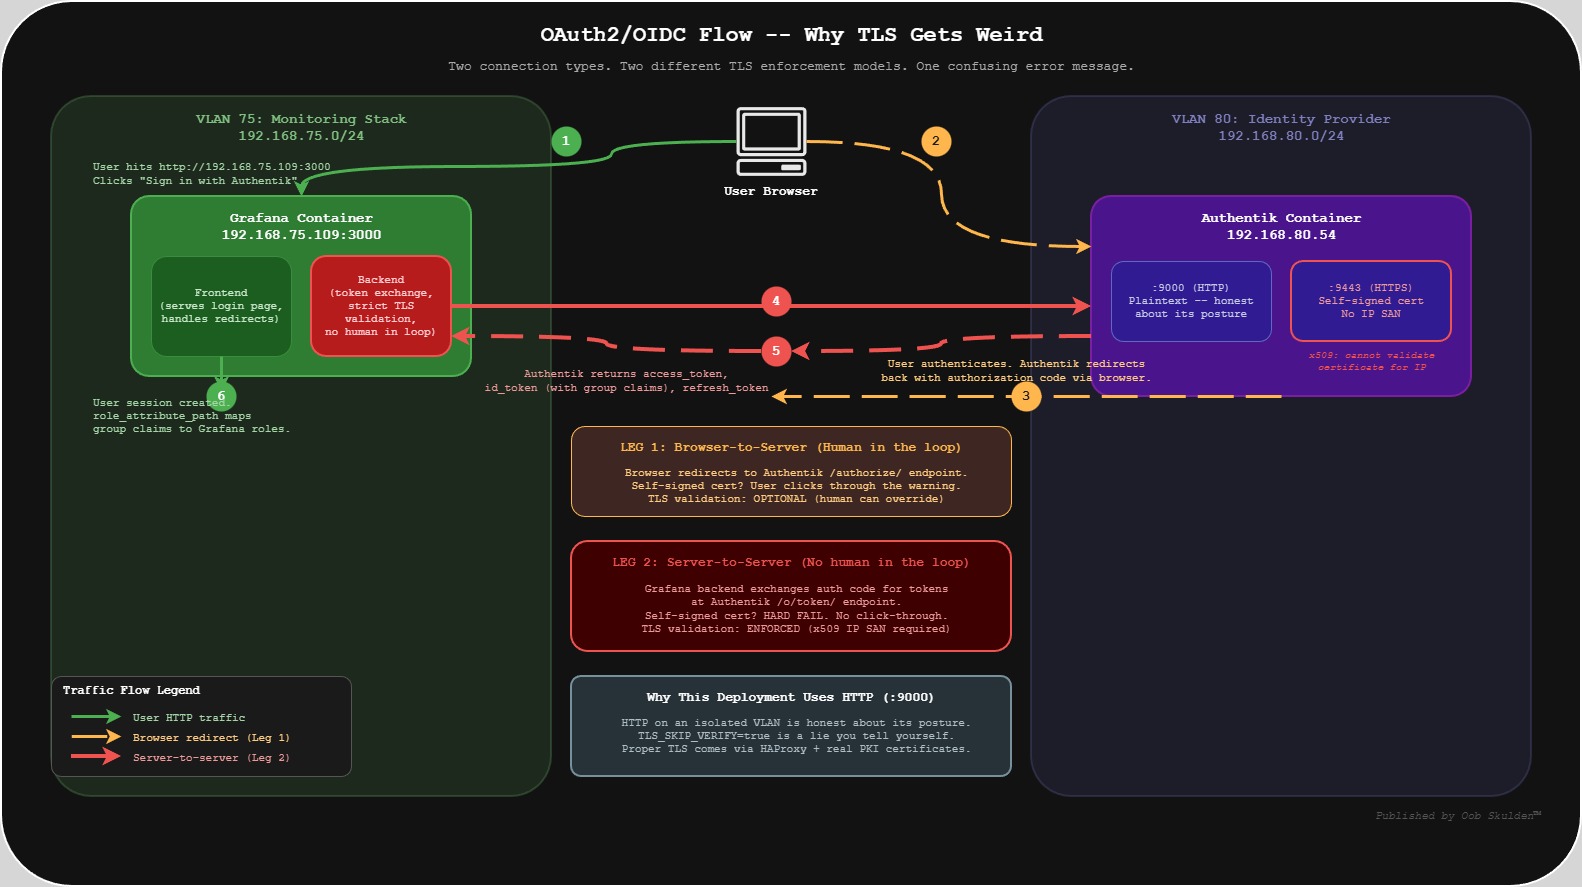
This distinction is why self-signed certs break OAuth in ways that aren’t immediately obvious. The browser half works fine. The server half silently rejects the certificate. Grafana logs x509: cannot validate certificate and the user sees a generic “Login failed” message.
The pragmatic choice for this deployment: use Authentik’s HTTP endpoint (port 9000) on a private VLAN rather than HTTPS (9443) with TLS skip enabled. There’s a security argument for this beyond convenience. Running plaintext forces you to confront the actual trust model of your network. TLS_SKIP_VERIFY_INSECURE=true gives you the warm feeling of HTTPS with none of the actual guarantees – and worse, it trains you to stop thinking about what’s on the wire. HTTP on an isolated segment is honest about its posture. TLS skip is a lie you tell yourself. When TLS gets added properly – HAProxy with real certificates from a PKI backend – it’ll be because we understand exactly what we’re encrypting and why, not because a compliance checklist said to.
Deploying Authentik
Directory Structure
On the Authentik host (192.168.80.54):
mkdir -p ~/authentik/{data/media,certs,custom-templates}
cd ~/authentik
The data/ directory is where Authentik 2025.12 stores application data. The certs/ and custom-templates/ directories are empty for now but will be used when TLS and UI customization come into play.
Version-Specific Gotchas
Authentik 2025.12 changed several things that will bite you if you’re following older guides: Redis is gone. The volume mount path changed from ./media:/media to ./data:/data. And the environment variable names changed: POSTGRES_PASSWORD became PG_PASS, POSTGRES_USER became PG_USER, POSTGRES_DB became PG_DB. Use the old names and nothing connects.
Always download the version-specific compose file:
wget -O docker-compose.yml https://goauthentik.io/version/2025.12/docker-compose.yml
Secret Generation
This is where the first issue usually appears. The AUTHENTIK_SECRET_KEY must be at least 50 characters or Django throws security warning W009. The problem is that openssl rand -base64 32 | tr -dc 'a-zA-Z0-9' strips non-alphanumeric characters, and the output is routinely 25-40% shorter than the input byte count.
# Generate secrets with enough headroom
PG_PASS=$(openssl rand -base64 32 | tr -dc 'a-zA-Z0-9')
AUTHENTIK_SECRET_KEY=$(openssl rand -base64 64 | tr -dc 'a-zA-Z0-9')

# ALWAYS verify the actual length after filtering
echo -n "$AUTHENTIK_SECRET_KEY" | wc -c  # Must be 50+
echo -n "$PG_PASS" | wc -c
Using -base64 32 for the secret key is a trap. You’ll get 40-something characters and spend 15 minutes wondering why Authentik is complaining during startup.
Save both secrets in a password manager immediately after generation, before doing anything else. If you lose them mid-setup, you’re starting over. Use only alphanumeric characters to avoid shell parsing issues with special characters in .env files.
Also worth knowing: the Authentik UI may truncate displayed secrets in the provider configuration page. Always generate secrets externally in the terminal and paste them in – don’t rely on Authentik’s UI to show you the full value.
Environment File
Nothing clever here. Credentials go in .env, permissions get locked down, and you move on.
# ~/authentik/.env
PG_DB=authentik
PG_USER=authentik
PG_PASS=<generated-password>
AUTHENTIK_SECRET_KEY=<generated-key-50+-chars>
AUTHENTIK_ERROR_REPORTING__ENABLED=false
AUTHENTIK_LOG_LEVEL=info
AUTHENTIK_COOKIE_DOMAIN=192.168.80.54
chmod 600 .env
Authentik Docker Compose
The 2025.12 compose file defines three services. If you downloaded the official one from goauthentik.io, verify it matches this structure. If you’re building it by hand – or you want to understand what you just downloaded – here’s what’s inside:
services:
  postgresql:
    image: docker.io/library/postgres:16
    container_name: authentik-postgresql
    restart: unless-stopped
    healthcheck:
      test: ["CMD-SHELL", "pg_isready -d $${PG_DB} -U $${PG_USER}"]
      start_period: 20s
      interval: 30s
      retries: 5
      timeout: 5s
    volumes:
      - database:/var/lib/postgresql/data
    environment:
      POSTGRES_PASSWORD: ${PG_PASS}
      POSTGRES_USER: ${PG_USER:-authentik}
      POSTGRES_DB: ${PG_DB:-authentik}
    env_file:
      - .env

  server:
    image: ghcr.io/goauthentik/server:2025.12.3
    container_name: authentik-server
    restart: unless-stopped
    command: server
    environment:
      AUTHENTIK_POSTGRESQL__HOST: postgresql
      AUTHENTIK_POSTGRESQL__USER: ${PG_USER:-authentik}
      AUTHENTIK_POSTGRESQL__NAME: ${PG_DB:-authentik}
      AUTHENTIK_POSTGRESQL__PASSWORD: ${PG_PASS}
    volumes:
      - ./data:/data
      - ./custom-templates:/templates
    env_file:
      - .env
    ports:
      - "9000:9000"
      - "9443:9443"
    depends_on:
      postgresql:
        condition: service_healthy

  worker:
    image: ghcr.io/goauthentik/server:2025.12.3
    container_name: authentik-worker
    restart: unless-stopped
    command: worker
    environment:
      AUTHENTIK_POSTGRESQL__HOST: postgresql
      AUTHENTIK_POSTGRESQL__USER: ${PG_USER:-authentik}
      AUTHENTIK_POSTGRESQL__NAME: ${PG_DB:-authentik}
      AUTHENTIK_POSTGRESQL__PASSWORD: ${PG_PASS}
    volumes:
      - ./data:/data
      - ./certs:/certs
      - ./custom-templates:/templates
    env_file:
      - .env
    depends_on:
      postgresql:
        condition: service_healthy

volumes:
  database:
    driver: local
Notice there’s no Redis service. If you’re following a guide that tells you to add one, that guide is outdated. Authentik 2025.12 handles caching and task queuing entirely through PostgreSQL. Redis references in your compose file or environment will either be silently ignored or actively break things.
Deploy and Bootstrap
docker compose up -d
Give it a minute. Authentik’s first startup involves database migrations, and the worker won’t report healthy until they’re done. Verify all three containers are running:
docker compose ps

# Expected:
# authentik-server       running   0.0.0.0:9000->9000/tcp
# authentik-worker       running
# authentik-postgresql   running (healthy)
Check the server logs for any secret key warnings:
docker compose logs server | grep -i 'secret\|error\|warning' | head -20
Once the containers are healthy, hit the bootstrap URL at http://192.168.80.54:9000/if/flow/initial-setup/ to set the admin credentials.
Email: admin@lab.local
Username: akadmin
Password: [set a strong password -- save in password manager immediately]
This page only works against a fresh database. If you see “Flow does not apply to current user,” an admin already exists from a previous run. The fix is docker compose down -v to nuke the volumes, then docker compose up -d, then use an incognito window because stale session cookies will also cause this error.
Verify Authentik Health
Trust but verify. Containers showing “Up” in docker compose ps doesn’t mean the application is actually working. Check that the database is reachable and the server is processing requests:
# Check PostgreSQL connectivity
docker exec -it authentik-postgresql psql -U authentik -d authentik -c "\dt" | head -5

# Follow server logs
docker compose logs -f server
# Wait for the "Starting authentik server" message

# Check worker logs
docker compose logs worker | tail -20
If everything looks clean, access the admin interface at http://192.168.80.54:9000 and log in with the akadmin credentials you just set. If it loads and you can navigate, Authentik is ready for the next step.
Password Reset (If Needed)
If you lose the admin password:
# Reset password (ONE WORD -- this is a common gotcha)
docker exec -it authentik-server ak changepassword akadmin

# Common mistakes:
# ak change_password akadmin   <-- wrong (underscore)
# ak reset-password akadmin    <-- wrong (hyphen)
# ak changepassword akadmin    <-- correct
Deploying the Monitoring Stack
Create Docker Networks and Volumes
On the Grafana host (192.168.75.109):
Create the networks and volumes before deploying anything. Docker Compose can create these automatically, but that’s a trap – docker compose down -v will cheerfully destroy them along with everything inside. Creating them manually and marking them external in the compose file means your Grafana dashboards and Prometheus history survive a bad day.
# Create Docker networks
docker network create grafana_network
docker network create prometheus_network

# Verify networks
docker network ls | grep -E 'grafana|prometheus'

# Create persistent volumes
docker volume create grafana-data
docker volume create prometheus-data
docker volume create prometheus-config

# Verify volumes
docker volume ls | grep -E 'grafana|prometheus'
Directory Structure
mkdir -p ~/monitoring/{prometheus,grafana}
cd ~/monitoring
Prometheus Configuration
# ~/monitoring/prometheus/prometheus.yml
global:
  scrape_interval: 15s
  evaluation_interval: 15s

scrape_configs:
  - job_name: 'prometheus'
    static_configs:
      - targets: ['localhost:9090']

  - job_name: 'grafana'
    static_configs:
      - targets: ['grafana:3000']

  - job_name: 'node-exporter'
    static_configs:
      - targets: ['node-exporter:9100']

  - job_name: 'cadvisor'
    static_configs:
      - targets: ['cadvisor:8080']

  - job_name: 'blackbox'
    static_configs:
      - targets: ['blackbox-exporter:9115']
Notice the scrape targets use container names like grafana:3000 and node-exporter:9100 instead of IP addresses. Docker Compose creates an internal DNS where each container’s service name resolves to its IP on the shared bridge network. This is why http://prometheus:9090 works inside the stack – it’s not a hostname you configured, it’s Docker’s built-in service discovery.
Monitoring Stack Docker Compose
# ~/monitoring/docker-compose.yml
networks:
  grafana_network:
    external: true
  prometheus_network:
    external: true

volumes:
  grafana-data:
    external: true
  prometheus-data:
    external: true
  prometheus-config:
    external: true

services:
  grafana:
    image: grafana/grafana:latest
    container_name: grafana
    restart: unless-stopped
    networks:
      - grafana_network
    ports:
      - "3000:3000"
    volumes:
      - grafana-data:/var/lib/grafana
    env_file:
      - .env
    environment:
      - GF_SECURITY_ADMIN_USER=${GF_SECURITY_ADMIN_USER}
      - GF_SECURITY_ADMIN_PASSWORD=${GF_SECURITY_ADMIN_PASSWORD}
      - GF_SERVER_ROOT_URL=http://192.168.75.109:3000
      - GF_INSTALL_PLUGINS=grafana-clock-panel,grafana-simple-json-datasource,grafana-piechart-panel

  prometheus:
    image: prom/prometheus:latest
    container_name: prometheus
    restart: unless-stopped
    networks:
      - grafana_network
      - prometheus_network
    ports:
      - "9090:9090"
    volumes:
      - prometheus-config:/etc/prometheus
      - prometheus-data:/prometheus
      - ./prometheus/prometheus.yml:/etc/prometheus/prometheus.yml:ro

  blackbox-exporter:
    image: prom/blackbox-exporter:latest
    container_name: blackbox-exporter
    restart: unless-stopped
    networks:
      - grafana_network
    ports:
      - "9115:9115"

  node-exporter:
    image: prom/node-exporter:latest
    container_name: node-exporter
    restart: unless-stopped
    networks:
      - prometheus_network
    ports:
      - "9100:9100"
    volumes:
      - /proc:/host/proc:ro
      - /sys:/host/sys:ro
      - /:/rootfs:ro,rslave
    command:
      - '--path.procfs=/host/proc'
      - '--path.sysfs=/host/sys'
      - '--path.rootfs=/rootfs'

  cadvisor:
    image: gcr.io/cadvisor/cadvisor:latest
    container_name: cadvisor
    restart: unless-stopped
    networks:
      - prometheus_network
    ports:
      - "8080:8080"
    volumes:
      - /:/rootfs:ro,rslave
      - /var/run:/var/run:ro
      - /sys:/sys:ro
      - /var/lib/docker:/var/lib/docker:ro
      - /dev/disk:/dev/disk:ro
    privileged: true
A few things worth calling out in this compose file.
Networks and volumes are external: true because we created them manually above. That’s the safety net – docker compose down -v won’t touch them. Only an explicit docker volume rm will destroy your data. Learn from my mistakes on this one.
Prometheus sits on both networks because it has to. It needs grafana_network so Grafana can query it, and prometheus_network so it can scrape Node Exporter and cAdvisor. No other container needs to span both – and that’s the point. Least privilege at the network layer.
Node Exporter mounts /proc, /sys, and / as read-only to collect host-level metrics. The rslave mount propagation on /rootfs ensures it sees bind mounts from the host. cAdvisor needs /var/lib/docker and /var/run to monitor container resource usage, and yes, it requires privileged: true for full access to cgroup data. That’s a security trade-off we’ll revisit in hardening.
Create the Environment File
The .env file needs to exist before the first docker compose up – even if it’s sparse. Without it, Compose fails immediately with a missing file error rather than a helpful message.
# ~/monitoring/.env
GF_SECURITY_ADMIN_USER=admin
GF_SECURITY_ADMIN_PASSWORD=<your-secure-admin-password>
chmod 600 .env
Deploy the Stack
cd ~/monitoring
docker compose up -d
Five containers should come up. Verify:
docker compose ps

# Expected:
# grafana             Up      0.0.0.0:3000->3000/tcp
# prometheus          Up      0.0.0.0:9090->9090/tcp
# blackbox-exporter   Up      0.0.0.0:9115->9115/tcp
# node-exporter       Up      0.0.0.0:9100->9100/tcp
# cadvisor            Up (healthy)  0.0.0.0:8080->8080/tcp
Check the Grafana logs for anything ugly:
docker compose logs grafana | head -30
Verify the Container Network Layout
This is worth checking explicitly. If Prometheus isn’t on both networks, half your scrape targets will show as “DOWN” and the error messages won’t tell you why.
# Check which containers are on each network
docker network inspect grafana_network --format '{{range .Containers}}{{.Name}} {{.IPv4Address}}{{"\n"}}{{end}}'
docker network inspect prometheus_network --format '{{range .Containers}}{{.Name}} {{.IPv4Address}}{{"\n"}}{{end}}'

# Prometheus should appear in both networks
Access Grafana at http://192.168.75.109:3000 and log in with the admin credentials from your .env file.
Adding Prometheus as a Datasource
In Grafana, go to Connections, then Data sources, then Add data source, and select Prometheus. Set the URL to http://prometheus:9090 – this is the Docker internal hostname, not the host IP. Click Save & test. Green means the stack is wired up. If it fails, Prometheus isn’t on grafana_network.
Verify Prometheus Scrape Targets
Hit http://192.168.75.109:9090/targets in your browser. All five scrape jobs should show with a recent “Last Scrape” timestamp. If any target shows “DOWN,” the problem is almost always that a container is on the wrong Docker network. Check the network layout from the previous step.
Exposed Ports
One thing to flag before moving on: by default, every service in this stack binds to 0.0.0.0. That means Prometheus (which has no authentication), Node Exporter, cAdvisor, and Blackbox Exporter are all accessible to anyone who can route to the host.
The instinct is to say “just bind everything to 127.0.0.1” – but that doesn’t work in practice. Prometheus has to reach the exporters over the network to scrape metrics. Grafana has to reach Prometheus to query data. If exporters are running on separate hosts or VLANs – which they are in most production environments – binding to localhost means Prometheus can’t talk to them at all. The whole scrape architecture assumes network reachability between the collector and its targets. That’s why monitoring stacks are one of the most reliably exposed attack surfaces in enterprise environments. These ports aren’t open because someone forgot to close them. They’re open because the architecture requires it, and nobody goes back to add restrictions after the dashboards are working.
The real mitigation isn’t binding to localhost – it’s host-level firewalling. iptables, nftables, or whatever host firewall your environment runs, scoped to allow only the specific source IPs that need access to each port. Prometheus scrapes Node Exporter? Allow 9100 from the Prometheus host only. Grafana queries Prometheus? Allow 9090 from the Grafana host only. Everything else gets dropped. That’s straightforward to implement and it actually matches how these stacks are deployed, instead of pretending everything can live on loopback.
We’re leaving them wide open here for the same reason we’re running HTTP: you need to see the exposure before you close it. The hardening post will walk through the firewall rules.
Wiring Up OAuth
Create the OAuth2 Provider in Authentik
In Authentik’s admin interface (http://192.168.80.54:9000), navigate to Admin > Applications > Providers > Create and configure an OAuth2/OpenID Provider:
| Setting | Value |
|---|---|
| Name | grafana-oidc-provider |
| Provider Type | OAuth2/OpenID Provider |
| Authorization Flow | default-provider-authorization-implicit-consent |
| Client Type | Confidential |
| Client ID | grafana-client |
| Redirect URIs | http://192.168.75.109:3000/login/generic_oauth |
| Signing Key | authentik Self-signed Certificate |
| Subject Mode | Based on User’s UPN |
| Include claims in id_token | Enabled |
| Scopes | openid, profile, email, groups |
The groups scope is critical – without it, Grafana never sees group membership in the token claims, and role-based access control won’t work.
The Client Secret
The client secret must be exactly 128 characters and byte-for-byte identical on both the Authentik and Grafana sides. One extra character – including an invisible trailing newline – causes “Failed to get token from provider” with no further explanation.
# Generate a clean 128-char secret
OAUTH_SECRET=$(openssl rand -base64 128 | tr -dc 'a-zA-Z0-9' | head -c 128)

# Verify BEFORE pasting anywhere
echo -n "$OAUTH_SECRET" | wc -c  # Must return exactly 128
Use -base64 128, not 96. After tr strips non-alphanumeric characters, 96 bytes of base64 frequently yields fewer than 128 usable characters. Generate it in the terminal, verify the count, then paste it into both Authentik’s provider config and Grafana’s .env. Save it in your password manager immediately.
To set it in Authentik: navigate to Providers > grafana-oidc-provider > Edit, clear the Client Secret field completely, paste your 128-character secret, and click Update. Do not use the built-in “Generate” button – it produces a secret that the UI may truncate on display, making it impossible to verify the full value.
Create the Authentik Application
Navigate to Admin > Applications > Applications > Create:
Name: Grafana
Slug: grafana
Provider: grafana-oidc-provider (select from dropdown)
Launch URL: http://192.168.75.109:3000
Policy engine mode: any
The slug must be grafana exactly – not Grafana, not grafana-monitoring, not anything creative. The OIDC discovery URL is derived from it: http://192.168.80.54:9000/application/o/grafana/.well-known/openid-configuration. If the slug doesn’t match, that endpoint returns a 404 and the entire OAuth flow fails with no useful error message.
Verify OIDC Discovery
Before touching Grafana’s config, confirm the discovery endpoint works:
curl http://192.168.80.54:9000/application/o/grafana/.well-known/openid-configuration | jq
This should return JSON with issuer, authorization_endpoint, token_endpoint, and userinfo_endpoint:
{
  "issuer": "http://192.168.80.54:9000/application/o/grafana/",
  "authorization_endpoint": "http://192.168.80.54:9000/application/o/authorize/",
  "token_endpoint": "http://192.168.80.54:9000/application/o/token/",
  "userinfo_endpoint": "http://192.168.80.54:9000/application/o/userinfo/",
  "jwks_uri": "http://192.168.80.54:9000/application/o/grafana/jwks/"
}
If you get a 404, the application slug doesn’t match “grafana.” If the connection is refused, check that port 9000 is accessible from the Grafana host across VLANs.
Group-Based Access Control
Create three groups in Authentik under Admin > Directory > Groups:
| Group Name | Grafana Role | Purpose |
|---|---|---|
| Grafana Admins | Admin | Full admin access |
| Grafana Editors | Editor | Dashboard creation and editing |
| Grafana Viewers | Viewer | Read-only dashboard access |
Then bind all three groups to the Grafana application: go to Admin > Applications > Grafana > Policy / Group / User Bindings, add each group as a binding, and set the policy engine to “any.” Users not in any of these groups get denied at the Authentik level and never reach Grafana at all. That’s defense-in-depth working as intended.
Create Test Users
This step is not optional. Create dedicated test accounts in Authentik under Admin > Directory > Users. Do not test OAuth with the akadmin account. You will regret it. Issue #11 below documents exactly what happens when admin test data pollutes Grafana’s user database – and the fix is more annoying than the five minutes it takes to create proper test accounts.
Test Admin User:
  Username: grafana-admin
  Email: grafana-admin@lab.local
  Groups: Grafana Admins

Test Viewer User:
  Username: grafana-viewer
  Email: grafana-viewer@lab.local
  Groups: Grafana Viewers
Configure Grafana for OAuth
Update the Grafana .env file with the full OAuth configuration. Configure all of these at once. Partial OAuth configuration causes cascading cryptic errors that are nearly impossible to diagnose individually.
GF_SERVER_ROOT_URL is mandatory. Without it, Grafana constructs OAuth redirect URIs using localhost, and Authentik rightfully rejects them.
# ~/monitoring/.env
GF_SECURITY_ADMIN_USER=admin
GF_SECURITY_ADMIN_PASSWORD=<your-secure-admin-password>
GF_SERVER_ROOT_URL=http://192.168.75.109:3000
GF_AUTH_GENERIC_OAUTH_ENABLED=true
GF_AUTH_GENERIC_OAUTH_NAME=Authentik
GF_AUTH_GENERIC_OAUTH_CLIENT_ID=grafana-client
GF_AUTH_GENERIC_OAUTH_CLIENT_SECRET=<128-char-secret>
GF_AUTH_GENERIC_OAUTH_SCOPES=openid profile email groups
GF_AUTH_GENERIC_OAUTH_AUTH_URL=http://192.168.80.54:9000/application/o/authorize/
GF_AUTH_GENERIC_OAUTH_TOKEN_URL=http://192.168.80.54:9000/application/o/token/
GF_AUTH_GENERIC_OAUTH_API_URL=http://192.168.80.54:9000/application/o/userinfo/
GF_AUTH_GENERIC_OAUTH_ALLOW_SIGN_UP=true
GF_AUTH_GENERIC_OAUTH_AUTO_LOGIN=false
GF_AUTH_GENERIC_OAUTH_ROLE_ATTRIBUTE_PATH=contains(groups[*], 'Grafana Admins') && 'Admin' || 'Viewer'
GF_USERS_ALLOW_SIGN_UP=false
chmod 600 .env
docker compose up -d --force-recreate
That --force-recreate flag is not optional. docker compose restart does not reload .env variables. Environment variables are baked into the container at creation time. If you change the .env and just restart, nothing changes, and you’ll spend an hour wondering why your config updates aren’t taking effect.
The role_attribute_path JMESPath expression handles group-to-role mapping: if a user is in the “Grafana Admins” group, they get Admin. Everyone else gets Viewer.
Validation
First, confirm Grafana actually loaded the OAuth configuration. This sounds obvious. It is not.
docker exec grafana env | grep GF_AUTH
If this returns nothing, the container wasn’t recreated properly. Run docker compose up -d --force-recreate again. This is Issue #6 in action.
Now test the full OAuth flow with your dedicated test accounts. Four scenarios, all of them matter:
Admin test: Open http://192.168.75.109:3000, click “Sign in with Authentik,” log in as grafana-admin. Verify you land on the Grafana dashboard with Admin role. Confirm you can access Configuration (gear icon) and Server Admin (shield icon).
Viewer test: Log out, log in as grafana-viewer. Verify you get Viewer-level access – no admin capabilities, read-only dashboard access.
Denied test: Try logging in with a user who is not in any of the three Grafana groups. Authentik should deny the request before it ever reaches Grafana.
Fallback test: This is the one people skip and then panic about later. Log out, click “Sign in” (not the OAuth button), enter the local admin credentials from your .env file. This must work. It’s your disaster recovery path if Authentik goes down, and you don’t want to discover it’s broken at 2 AM.
Verify Group Claims in Logs
docker compose logs grafana 2>&1 | grep -i 'groups' | tail -10
You should see the groups claim in the OAuth response, confirming that Authentik is sending group membership and Grafana is receiving it.
The 11 Things That Broke
This is the section that would have saved the most time if it existed before starting this deployment. Every issue below was encountered across the initial build and a subsequent rebuild.
1. Django SECRET_KEY Warning (W009)
Authentik logs showed the secret key was too short. Root cause: openssl rand -base64 32 | tr -dc 'a-zA-Z0-9' strips enough characters that the output drops below 50. Fix: use -base64 64 and verify with wc -c.
2. “Flow Does Not Apply to Current User”
The initial setup page denied access. The PostgreSQL volume still had data from a previous installation, and the bootstrap flow only fires against an empty database. Fix: docker compose down -v and use an incognito window.
3. Database Lock Hang
Authentik logged “waiting to acquire database lock” and froze. The worker container was holding the migration lock. A simple restart doesn’t release it. Fix: full docker compose down then docker compose up -d.
4. Environment Variable Name Mismatch
Authentik couldn’t find POSTGRES_PASSWORD because the 2025.12 compose file expects PG_PASS. This one’s entirely a documentation problem – older guides use the old names, and the error message doesn’t suggest the correct variable.
5. Prometheus Mount Error
“Are you trying to mount a directory onto a file?” The compose file referenced ./prometheus.yml but the actual file lived at ./prometheus/prometheus.yml. Docker silently creates a directory when the source file doesn’t exist at the specified path, then throws this error when it tries to mount that directory onto a file target.
6. OAuth Button Missing from Grafana Login
The “Sign in with Authentik” button wasn’t showing up. Running docker exec grafana env | grep GF_AUTH revealed zero OAuth variables, even though the .env file was correct. Root cause: docker compose restart was used instead of docker compose up -d --force-recreate. The restart command reuses the existing container with its original environment.
7. Redirect URI Error (Grafana Sends Localhost)
Clicking the OAuth button redirected to Authentik, which rejected the request due to a mismatched redirect URI. Inspecting the browser URL bar during the redirect revealed that Grafana was sending redirect_uri=http://localhost:3000/... instead of the actual IP. Fix: set GF_SERVER_ROOT_URL.
8. TLS Certificate Rejection (x509 IP SAN)
After successful Authentik login, Grafana displayed “Login failed: Failed to get token from provider.” Grafana’s logs showed: x509: cannot validate certificate for 192.168.80.54 because it doesn't contain any IP SANs. Authentik’s self-signed cert doesn’t include the IP in the SAN field. The browser half of OAuth worked fine; the server-to-server token exchange did not. The initial workaround was TLS_SKIP_VERIFY_INSECURE=true. The current approach is using HTTP on port 9000 instead – not as a shortcut, but because running plaintext on an isolated VLAN exposes the real trust boundaries in the architecture. Proper TLS comes via HAProxy with real PKI certificates once those trust boundaries are understood and documented.
9. Client Secret Mismatch (Off by One)
Same symptom as #8: “Failed to get token from provider.” But this time TLS wasn’t the problem. Running docker exec grafana env | grep CLIENT_SECRET | cut -d'=' -f2 | tr -d '\n' | wc -c returned 129 instead of 128. A single trailing character – probably a newline from the generation process – was enough to fail the token exchange. Authentik doesn’t need a restart after updating the secret in its UI; Grafana does (force-recreate).
10. “Sign Up Is Disabled”
The OAuth flow completed, Authentik authenticated the user, but Grafana refused to create the account. GF_AUTH_GENERIC_OAUTH_ALLOW_SIGN_UP=true controls whether OAuth-authenticated users get auto-provisioned. GF_USERS_ALLOW_SIGN_UP=false controls manual registration. You need both set explicitly.
11. User Sync Failed (Test Data Pollution)
A new dedicated user couldn’t log in: “User sync failed.” Grafana’s user list showed a conflicting record with the same email address but a different auth_id, left over from an earlier test login using the akadmin account. OAuth user provisioning uses email + auth_id as a compound identifier, and the stale record blocked the legitimate user. Fix: delete the conflicting user in Grafana’s admin UI. Broader lesson: never test OAuth with admin accounts. Always use dedicated test users.
What’s Deployed and What’s Exposed
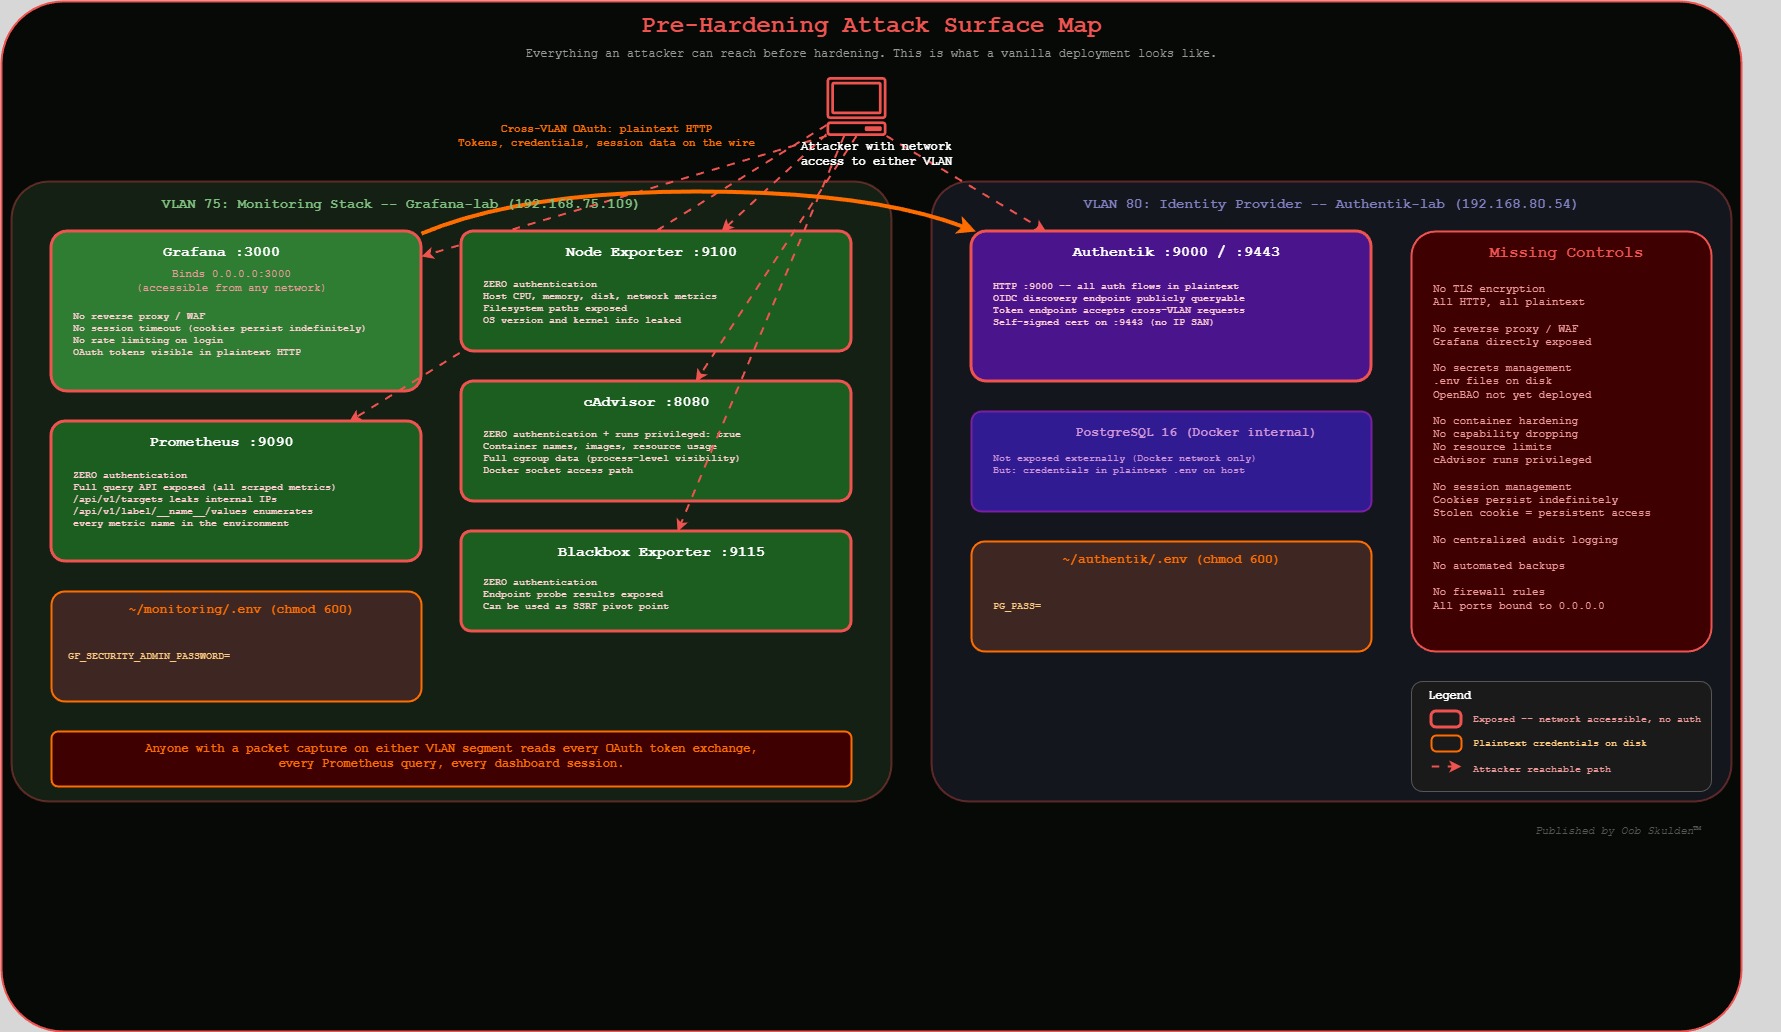
The stack is functional. Authentik handles authentication, Grafana serves dashboards with role-based access, Prometheus scrapes metrics from four exporters, and group-based policy enforcement denies access to users outside the permitted groups.
Now here’s what an attacker sees, and why we built it this way first. All traffic is plaintext HTTP across VLANs – anyone with a packet capture on either segment reads every OAuth token exchange, every Prometheus query, every dashboard session. The OAuth client secret sits in a plaintext .env file readable by anyone with shell access to the host. Grafana is directly exposed on port 3000 with no reverse proxy filtering requests. Prometheus and all four exporters are network-accessible with zero authentication – that’s unauthenticated access to host metrics, container metadata, and endpoint probe results. Default Grafana sessions persist indefinitely, so a stolen session cookie works until the server restarts. No container capability dropping, no resource limits, no automated backups, no centralized audit logging.
That’s a lot of exposure. That’s also what a vanilla deployment of these tools looks like in most environments, except most environments don’t write it down. We’re going to fix each of these systematically and document why.
The next post walks through these vulnerabilities in detail – what an attacker can actually reach, what data they can pull, and how each exposure gets exploited in practice – then covers the hardening steps to close them. That means locking down exposed ports, adding HAProxy for TLS termination, configuring session timeouts, dropping container capabilities, and restricting the monitoring exporters to Docker-internal networks.
OpenBAO gets its own dedicated series. PKI certificate automation, runtime secret injection for OAuth credentials, Prometheus auth token provisioning – that’s a substantial deployment with its own architecture decisions and failure modes. Cramming it into a hardening post would do it a disservice.
Quick Reference
Authentik Operations
cd ~/authentik
docker compose up -d                    # Start stack
docker compose down                     # Stop stack (keep volumes)
docker compose down -v                  # Stop + DESTROY volumes (nuclear option)
docker compose ps                       # Check container status
docker compose logs -f server           # Follow server logs
docker compose logs server | grep SECRET_KEY  # Check for key warnings
docker exec -it authentik-server ak changepassword akadmin  # Reset admin password
Grafana Operations
cd ~/monitoring
docker compose up -d                    # Start stack
docker compose up -d --force-recreate   # Restart with new .env (REQUIRED after changes)
docker compose ps                       # Check container status
docker compose logs grafana             # View Grafana logs
docker exec grafana env | grep GF_AUTH  # Verify OAuth config loaded
OAuth Debugging Commands
# Verify client secret length (must be exactly 128)
docker exec grafana env | grep CLIENT_SECRET | cut -d'=' -f2 | tr -d '\n' | wc -c

# Test OIDC discovery endpoint
curl http://192.168.80.54:9000/application/o/grafana/.well-known/openid-configuration | jq

# Watch OAuth flow in real-time
docker compose logs -f grafana | grep -i 'oauth\|error\|token\|sync'

# Verify root URL is set
docker exec grafana env | grep ROOT_URL

# Verify OAuth env vars are loaded
docker exec grafana env | grep GF_AUTH

# Check which containers are on which network
docker network inspect grafana_network --format '{{range .Containers}}{{.Name}} {{end}}'
docker network inspect prometheus_network --format '{{range .Containers}}{{.Name}} {{end}}'

# Verify Prometheus scrape targets
curl -s http://192.168.75.109:9090/api/v1/targets | jq '.data.activeTargets[] | {job: .labels.job, health: .health}'
Clean Slate
# Grafana (destroys all dashboards, users, datasources)
cd ~/monitoring && docker compose down
docker volume rm grafana-data
docker volume create grafana-data
docker compose up -d

# Authentik (destroys database, all config)
cd ~/authentik && docker compose down -v
docker compose up -d
# Use incognito browser for initial-setup
File Structure
Authentik-lab (192.168.80.54):
~/authentik/
+-- .env                    # PG_PASS, AUTHENTIK_SECRET_KEY (chmod 600)
+-- docker-compose.yml      # 2025.12 compose (3 services: server, worker, postgresql)
+-- data/                   # Authentik application data
+-- custom-templates/       # Custom UI templates
+-- certs/                  # TLS certificates (future)

Grafana-lab (192.168.75.109):
~/monitoring/
+-- .env                    # OAuth config, Grafana admin creds (chmod 600)
+-- docker-compose.yml      # 5-service monitoring stack
+-- prometheus/
    +-- prometheus.yml      # Scrape configuration (5 jobs)
Published by Oob Skulden™ – Stay Paranoid.